

Our partner, XM, lets you access a free demo account to apply your knowledge.
No hidden costs, no tricks.

Keeping track of your stock investment portfolio is very important. Why? Because you might lose track of your money, especially if you are involved in several stocks, and executing several orders in one day.
A successful stock trader maintains a spreadsheet of their stock portfolio. The main reason behind this is to register what stocks they are trading, what information they need to keep, and how their money is being managed. Creating your portfolio helps you to visualize your capital, where you can calculate your expenditure, set your goals, and use it as a risk management tool.
Excel offers incorporated tools that automatically calculate stock information such as price, price change, market capitalization, and other information that you need to keep track of. Additionally, you can add your own formulas to compute how much you are trading and the worth of your investments.
There is a wide span of formulas that you can add in Excel to create your stock portfolio, and you need to know what information will be useful for you and how to organize your portfolio in a spreadsheet with Excel (or Google Sheets) using the following guide.

Open Excel (or use Google Sheets) to create a new spreadsheet and write down the stocks that you are holding, or the stocks that you are planning to purchase. For this example, let’s assume that you own shares in Facebook (Meta), Google, Apple, and Tesla. You can write these companies either by their business name, traded name or the ticker symbol they are listed under.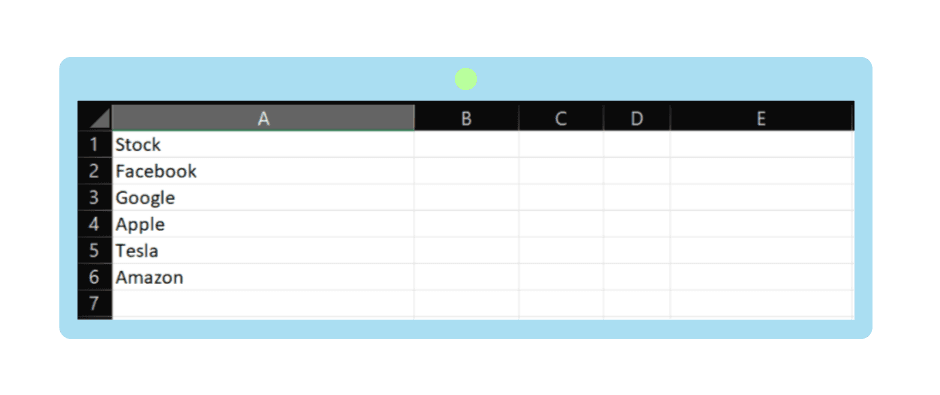
A spreadsheet enables you to convert corporation names into stocks, which will later generate relevant stock information. Select the set of data you are interested in, and from the top navigation bar, select Data, and click on Stocks.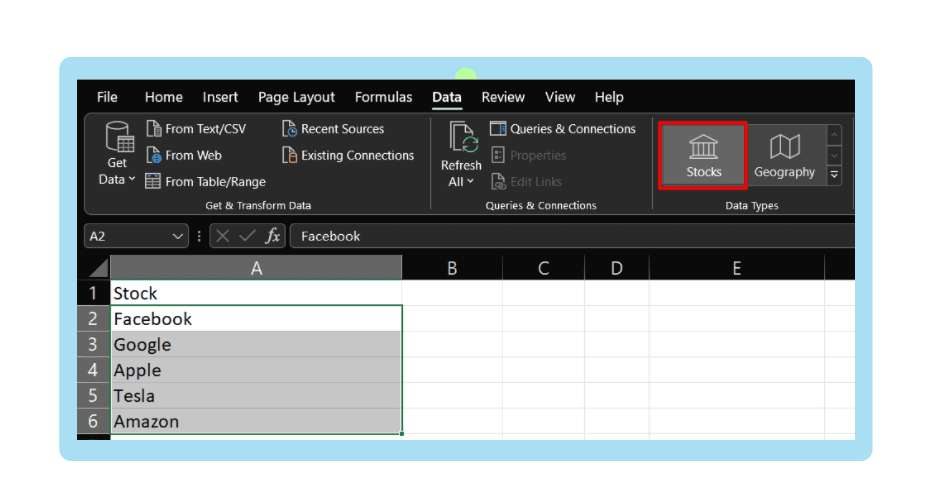
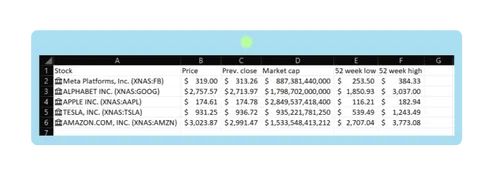
You will see the company stocks converted into their full business name, and their traded name in the stock exchange market denoted next to it.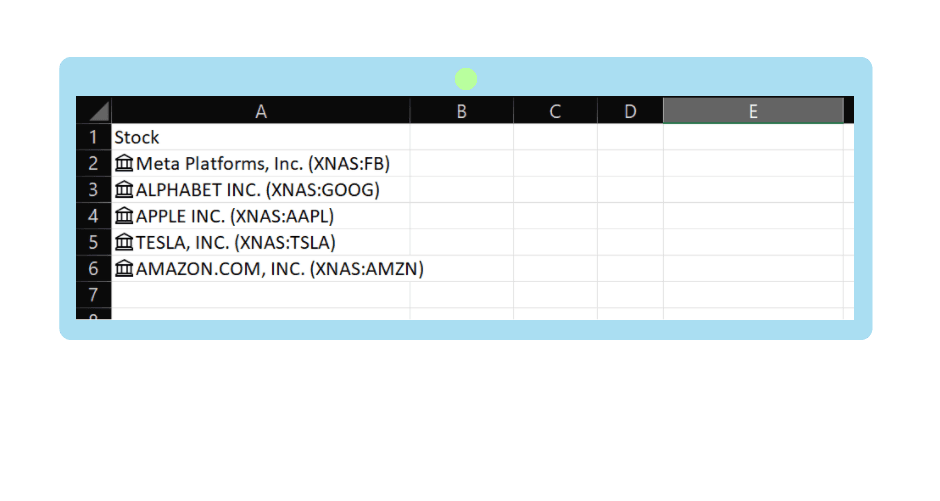
Click on any cell that contains a stock name in your portfolio. You will find an icon, and once you click on it, you will see a drop list. Then, you can select the information that you need to generate to create your investment portfolio in stocks as below.
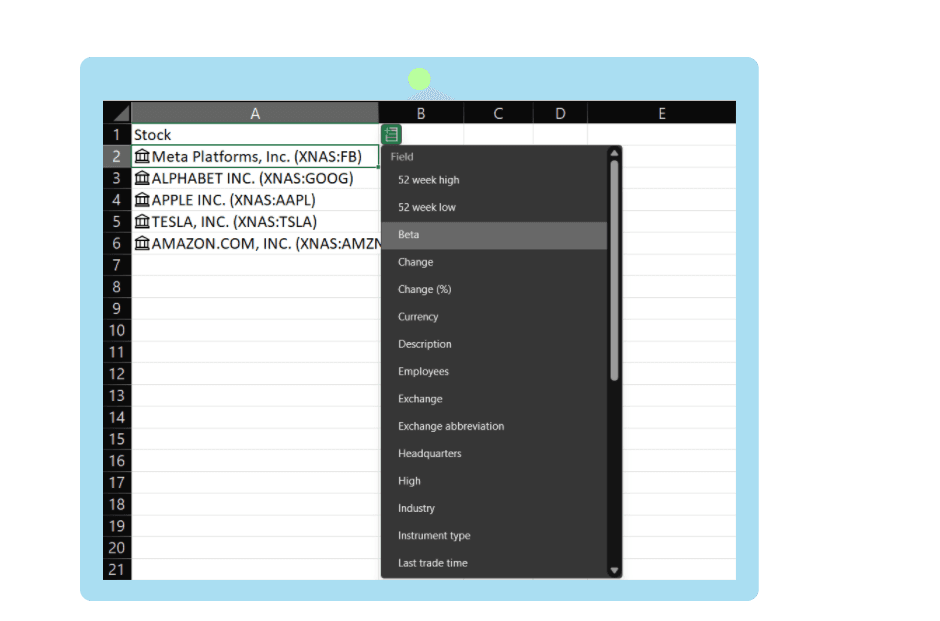
From the set of data options, you can choose the ones that interest you. Usually, traders prefer to see info such as stock price, market cap, and percentage of change. When you click on the data you want to generate you will see them getting added to your portfolio of stocks.
Note that the information retrieved from Excel about the stocks is updated once every day, after the closing hour of the market. Therefore, you should not expect it to have hourly updated data. You can use this data if you are drawing your goals or if you are buying and holding an asset for the long term.
In the following, we will teach you how to add information about your investment, the number of shares that you purchased, and the overall amount you spent.

Firstly, add the number of shares that you purchased from each stock in your stock portfolio. Let’s say that you purchased a number of shares as shown below.
Then, write down how much money you spent initially on each stock.
Now, calculate the worth of your investment in each corporation. We do this by multiplying column G with column H which shows the initial investment in column I.
Then, calculate the current value of each stock that you hold. We do that by multiplying column G with column B to see how much each of your initial investments is worth now.
Now, we add another column that indicates if you are gaining or losing in each stock that you hold. We set conditional formatting to visually see the value of the gain/loss.
We calculate the new column K by subtracting the initial investment in column I from the current value of each investment in column J.
Additionally, you can add a column that determines your target price to see how close/far you are from your target price in terms of percentage.
Also, you can insert charts and diagrams to understand the distribution of your investment portfolio, and what makes up your overall returns.
Note that we have added the aggregate totals of your initial investments, the current values of your investments, and the overall returns that you realize in your portfolio.
Depending on your trading style and the volume that you trade with, you alter the Excel sheet that you use to keep track of your portfolio. Some wealthy investors use huge capital to trade in different stocks and instruments, which may require additional tools of control and analysis.
If the stocks that you hold offer dividend payments, you can add the information to your portfolio of stock investment in Excel. That way, you will be able to separate the income that you receive from dividend payments.
Unfortunately, Microsoft Excel does not have a function to automatically retrieve dividend information that you can directly add to your table. Therefore, to manage your dividend receivables you need to manually check the yearly yield of each stock that you invest in, and add a table for the amount that you receive monthly, quarterly, or yearly.
Additionally, if a trader is involved in numerous stocks like 20+ companies from different industries, they may add filters to see which industry is more or less profitable.
Another way you can use Excel for a stock trading portfolio is to plan different scenarios. You can use the previously shown examples to conduct different scenarios for different sets of stocks. After that, you will be able to calculate and compare the profitability of each portfolio and make your decision about where to invest, and what you need to know before investing.
Our partner, XM, lets you access a free demo account to apply your knowledge.
No hidden costs, no tricks.
There is no right answer for it - it depends on the investor’s style and capital. Some traders get involved in 10 stocks maximum, to have better control of their market positions. While more experienced and wealthy investors may hold more than 25 stocks from different corporations, which helps diversify the risks.
Successful investors keep different types of stocks in their portfolios. They can include stocks with low to medium and high market capitalization, stocks of different markets (US, EU, Japan), and stocks from different industries. Such diversification works well because if one market performs poorly, it is more likely for another market to perform better, similarly in terms of market cap and industries.
You can use Microsoft Excel or Google spreadsheet to create your portfolio. You need to create a table that includes information about the stocks that you hold, and relevant information about price, price changes, market cap, etc. This helps you analyze and set your decision for the best investments that are most profitable for you.
© Copyright 2022, All rights reserved