

Our partner, XM, lets you access a free demo account to apply your knowledge.
No hidden costs, no tricks.

MetaTrader, MT for short, allows traders to create or download customized options that use a mix of technical indicators. These Forex trading tools in MT4 and MT5 enable different indicators to complement each other to optimize the chart view and analysis.
Forex traders that the MetaTrader 4 (MT4) or MetaTrader 5 (MT5) trading platforms enjoy a wide range of technical indicators that are available in both MT4 and MT5. The technical indicators include charting options, price analysis, and trend properties, which help traders better read and analyze the currency market movement. However, that’s not all.
When different indicators, chart options, and tools are mixed together, the trader can better identify price trends, and create a clear estimation of the projected price movement. This way, traders can be more confident in placing different market orders for successful Forex trading.
Most traders try different trading tools and indicators in Forex before they find the one that works best for them. In the following, we are going to discuss the best Forex trading tools in MT4 and MT5. We will explain what they are used for, and how you can use these tools.
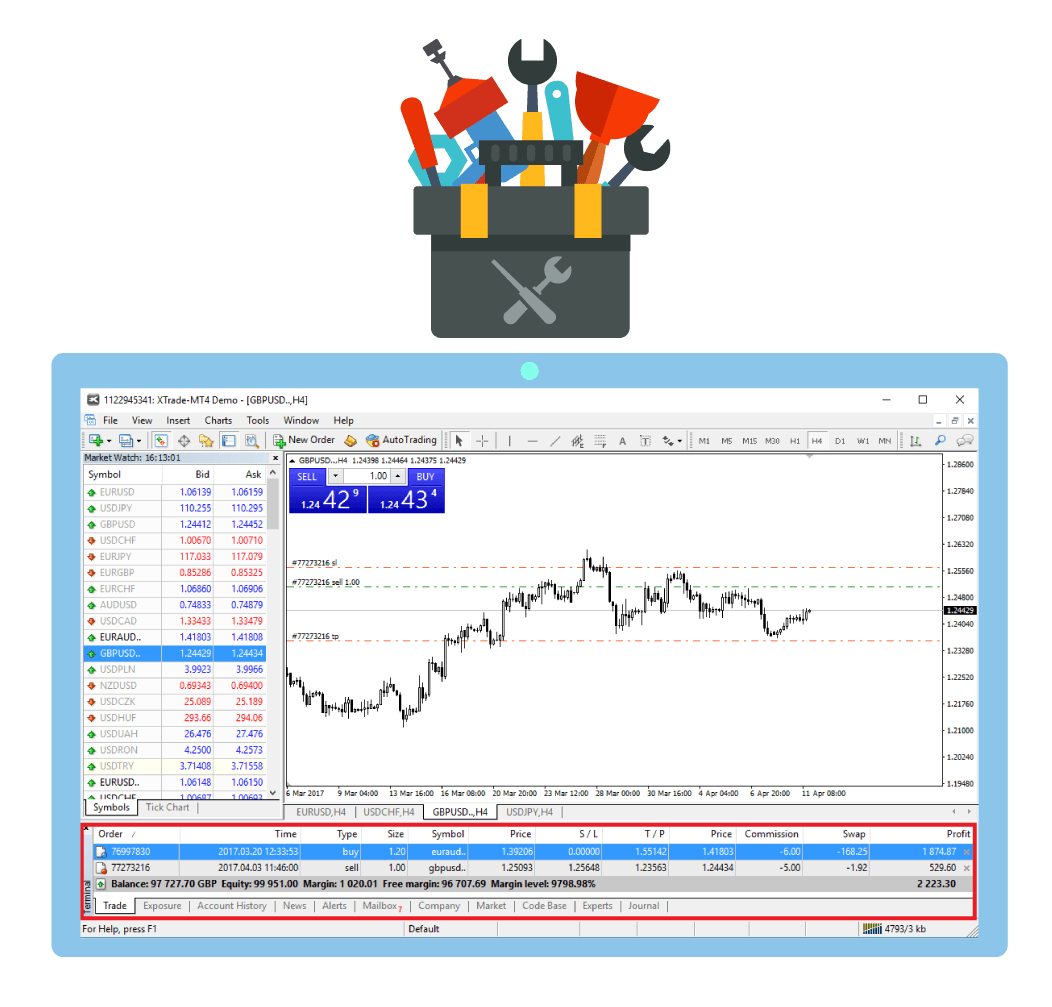
Both the MT4 and MT5 trading platforms come equipped with several built-in indicators, chart options, and tools that give users a smooth trading experience, and traders can freely pick and choose which indicators they want to use.
However, if a trader wants to level up their game and have a better grasp on their market positions, then mixing indicators, using advanced Forex trading tools, and using EAs for MT4 and MT5 will help to strengthen the features of technical indicators.
There are customized technical indicators that are created by traders around the world, MetaQuotes is one of these open-source marketplaces for MetaTrader. With its help, anyone can create a custom trading indicator if they have the knowledge and the coding skills to write code in the programming language used by MT4 or MT5.
The reason traders create custom trading tools for Forex is that almost every indicator has its own advantages and disadvantages. Traders usually mix several indicators and tools to cover the disadvantages inherent in each.
For example, the Fibonacci indicator is used to find market trends using different retracement levels. Each level might paint a different picture on the chart. Therefore, a trader might choose to mix the Fibonacci indicator with another indicator to rule out any misleading information the Fibonacci level is showing.
Some custom tools in Forex trading use the mix of an indicator with a chart option, to give a detailed analysis of the chart view. This makes it easier for the trader to understand what is happening on the chart.
However, not every indicator or option can be mixed together well, different indicators serve different purposes and traders may create a custom tool that performs a specific function, whether it is to locate trends, determine market entry/exit points, or draw an estimation of the future price.
"[!metatrader!] a system that includes not only trading
but also powerful mechanism couple with processing of housands of gigabytes of data, testing trading strategies, conducting in-depth market analysis, using algorithmic trading, and has the world best charting system" - Demis Gavrielides
There are some custom indicators that have gained popularity and are widely used by traders today. These custom indicators in Forex give the trader more advanced analytical options to help them make better trading decisions. In the following, we'll talk about the 6 best custom trading tools that we would recommend.
The Hercules scalping indicator is used by traders who use the scalping strategy in Forex. It is a widely used tool because it is easy to use and helps users to find the entry and exit points in the market.
Since the scalping strategy relies on making quick entries and exits from the market in small intervals that can be anywhere from 1 to 15 minutes. The Hercules scalping tool in Forex trading uses colors to indicate different market options for the traders. It detects every small change in the market in order for traders to make timely decisions.
This indicator uses blue and red colors on the candlestick chart to suggest a buy or sell order as per the following:
Note that when using this trading tool in Forex you may set any timeframe, however, it is recommended that you use a 5-minute timeframe, where you exit the market faster and enter again if the market is still moving in your favor.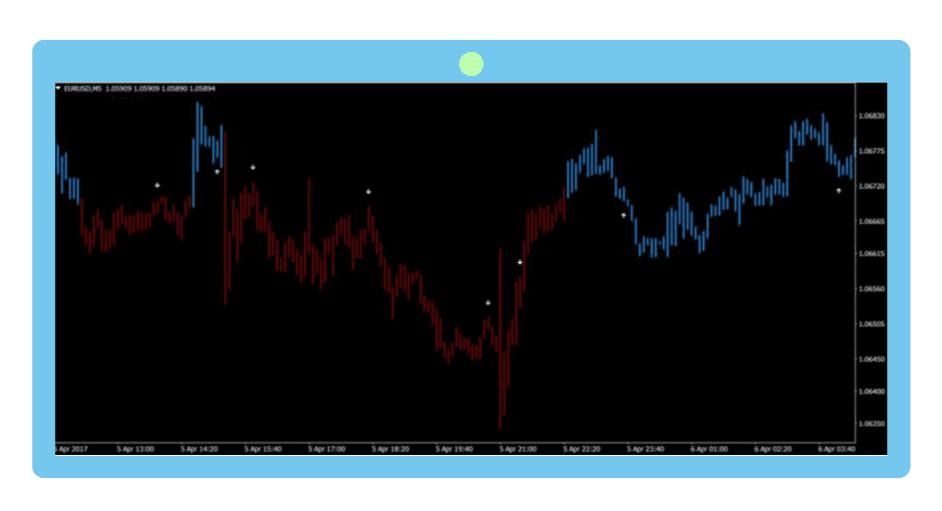
You can close the position whenever the candlestick color changes, or when it hits the stop-loss limit that you have set. When the market position is closed, you can enter again when the market is moving in the same direction, or trade in the other direction.
This custom indicator comprises two technical indicators - these are the (BB) Bollinger Bands and the (MACD) moving average convergence divergence indicator. The Bollinger Bands are two upper and lower bands that expand and contract according to market volatility.
The MACD is a trend-follower that predicts upcoming market momentum. Mixing these two indicators gives traders a useful custom Forex trading tool that shows what the projected price movement is and how strong that price movement is.
It is depicted on the chart with a dotted line, where the dots change colors in response to the suggested market order. The green color indicates an upward trend while the purple color points to a downward trend.
A buy order is suggested when the dots turn green as they cross the upper Bollinger Band in blue.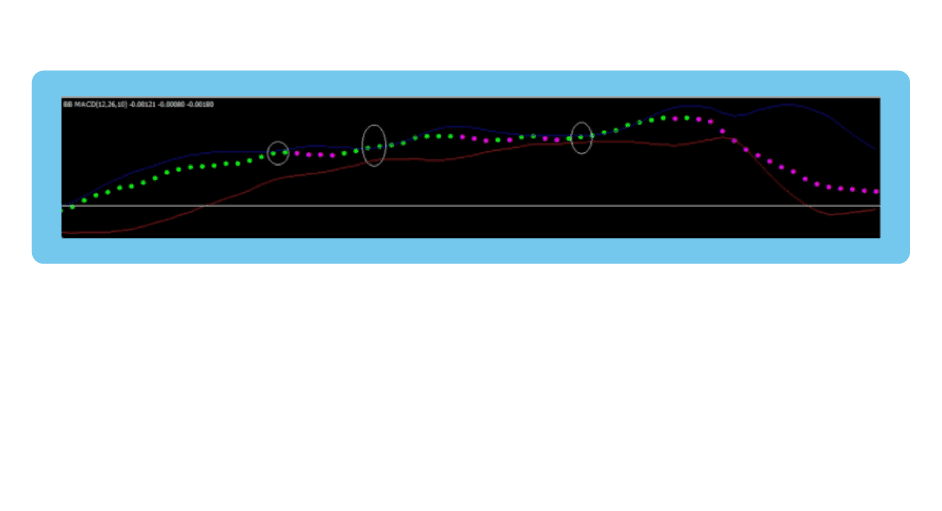
On the other hand, a sell order is suggested when the dots turn purple as they touch the lower Bollinger band in red.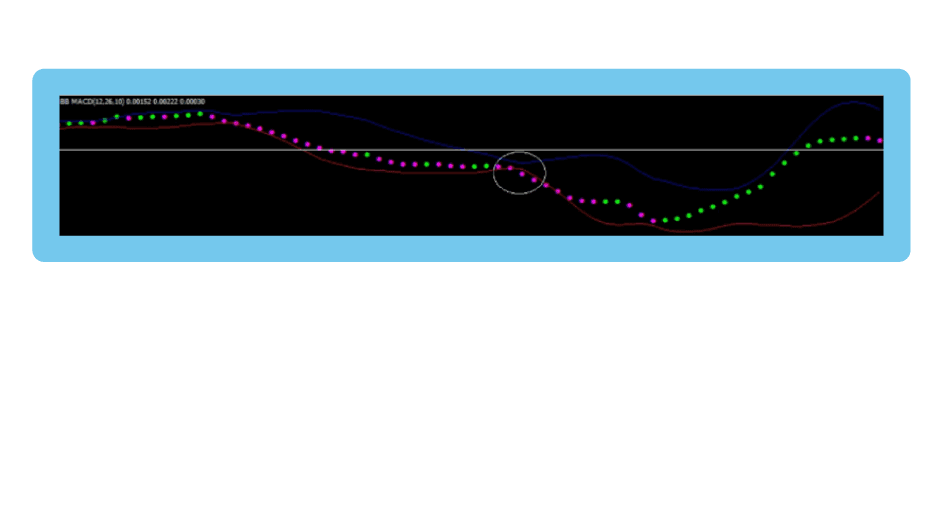
This custom Forex indicator also indicates the entry and exit moments in the market. A trader can enter the market when the dots turn green, which means the market price is on an upward trend. Similarly, the trader may exit the market when the dots turn purple in a down-slope price trend.
The Donchian channels might look similar to Bollinger Bands, however, this one measures the price momentum at maximum ups and lows. The price momentum is measured over a specific period of time set by the trader.
The Donchian channels consist of an upper line that measures the maximum price the market has reached over a certain period of time. While the lower line depicts the minimum price the market has reached over a specific period of time.
The middle line measures the average between these two limits, and it is called the Donchian channel. The middle line calculates the difference between the bullish and the bearish market movement, and it’s considered a basic line that traders follow to make their trading decisions.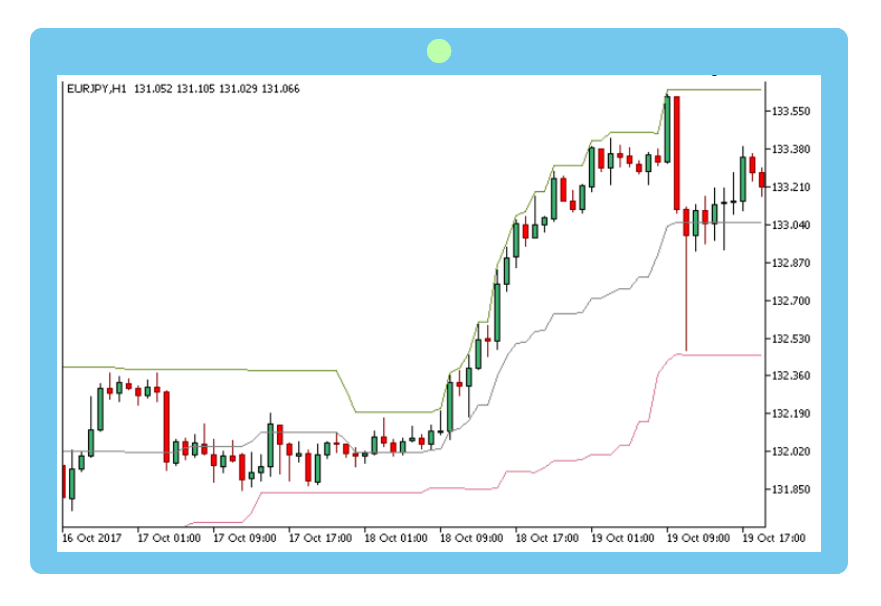
This Forex custom indicator is plotted on the price trend using the candlestick chart, and it measures the market price movement. If the market price moves around the middle line, it means the market is not volatile or has low volatility.
However, if the price trend moves far from the average line and towards that upper limit, it means the market is moving bullish, and it is a good opportunity for traders to execute a buy order.
On the other hand, if the market price moves downwards from the average line and toward the low limit, it means the market sentiment is bearish, and a sell order is suggested.
Regardless of the market order, a trader may open when the market price reaches one of the limits, it is more likely to rebound and change direction. At this point, traders usually close their market positions. Additionally, a trader can close the position when it reaches the maximum/minimum limit, and open an opposite market order.
This indicator shows the breakout points on the price chart. It aims to find two peak points in any direction, which is why it is called a double-top and double-bottom finder. The peak points suggest a market order for the trader.
Using this custom Forex tool, a trader can visually see the peak points drawn with a triangle in red or in blue. The triangle is painted red when the price has reached the top high two times and is going to decline, which indicates a sell order.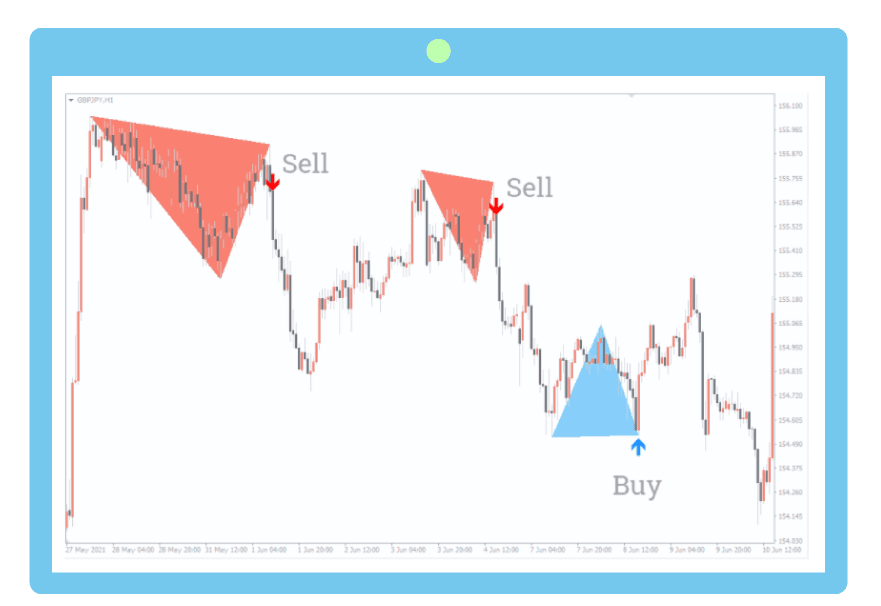
A blue triangle is painted when the market price has reached lows two times and is more likely going to pick up a bullish movement, indicating a buy order.
A backpropagation neural network uses machine algorithms to create an estimation of future price movement. It can be implemented on different timeframes, but since it aims at predicting upcoming Forex price movement, it is better to apply a 1-hour time frame and higher.
It uses three lines on the chart: black, blue, and red. The black line represents the market entry price, the blue line indicates the network output based on the study conducted by machine learning, and the red line (smoothing line) represents the projected prices.
Traders using this Forex price forecast tool can keep track of any upcoming trend. This helps traders create forecasts for their target profits, based on which they can decide on the amount of capital they will invest.
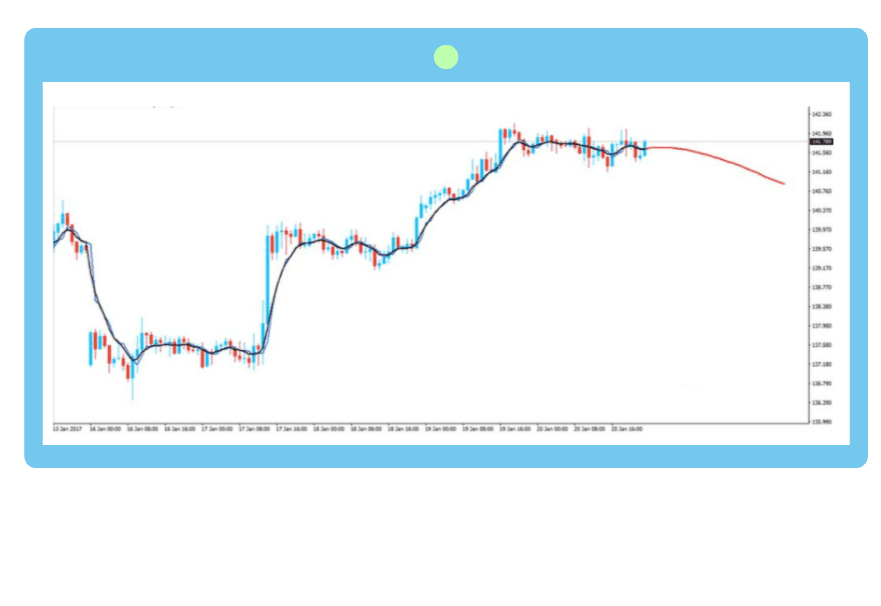
Using predictor indicators, a trader can simply understand what type of market order they need to execute. A buy order can be placed when the predicted price trend goes upward, and a sell order can be placed when the predicted market price is moving downwards.
As the name suggests, the candle time end and spread indicator work with the candlestick chart view. It is a custom technical indicator that shows the remaining time of the current candle, and the current spread of the traded asset.
The candle time end and spread indicator can be considered one of the best Forex trading tools for scalpers and day traders, who can see current updates live, to estimate if the gains made in the current trade cover the spread costs incurred by the broker.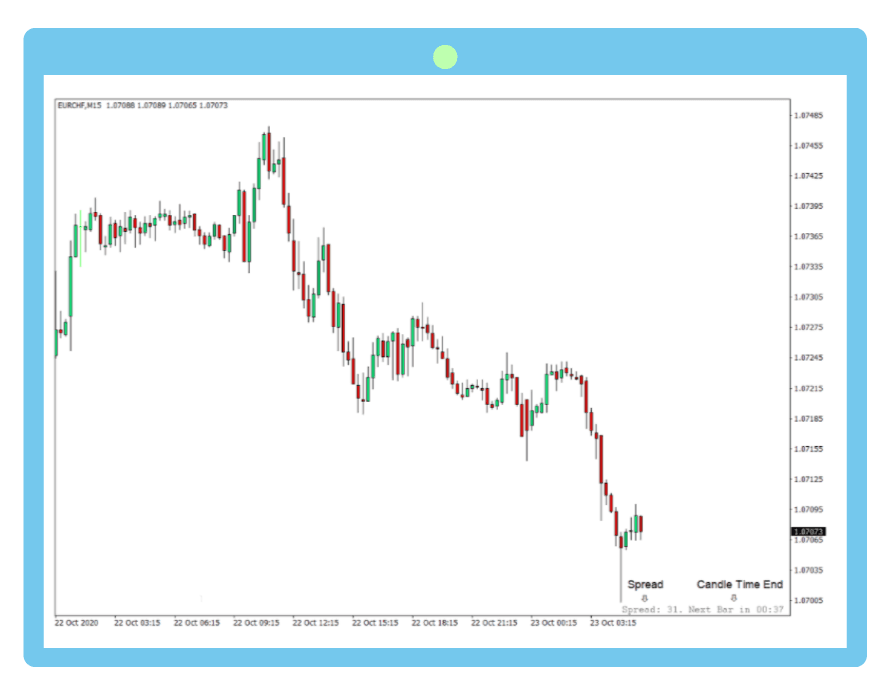
Scalping in the Forex market using this tool is quite useful. Scalpers use a short timeframe, and looking at the current spread, if the trader’s market position moved enough pips and goes higher than the spread, the trader is gaining from their current position.
This indicator automatically computes the time difference between the current and the next candlestick, which is shown beside the live spread on the corner of the trading view. This helps the traders know when the current candle is going to close, so they can prepare for the next step.
Using this tool, traders can identify the market momentum or breakouts and make their decision; enter with a buy option if the candle is showing a bullish movement, or enter with a sell order if the market shows a bearish trend.
Our partner, XM, lets you access a free demo account to apply your knowledge.
No hidden costs, no tricks.
First of all, a trader needs to identify the type of indicator they want to create. Either a brand new or a hybrid one. Then determine the patterns, mathematical functions, and formulas that shape the indicator’s function. Create a set of rules to control the indicator’s mechanism. Then you will need to code the indicator and the final stages include testing, bug fixing, and releasing the indicator on the MetaQuote marketplace.
The MT4 and MT5 marketplaces contain a huge number of indicators and custom tools that are downloadable. After you download the indicator that you want, you need to place it in the correct system folder in order to use it.
Copy the downloaded file, then go to the trader’s window to File, and click on Open Data Folder. From the folder, you need to open MQL4, open indicators, and paste the new indicators in this folder. After this, you restart the trading platform, and you will be able to find your added indicator under the custom indicators section.
Yes, there are definitely some paid indicators that are really worth it as they are developed by experienced traders who know mathematics and programming well enough to compose their indicators. The free indicators work just fine, but the paid ones can be better or give better options with more control tools.
However, not every paid indicator is worth it. Make sure you really need the indicators depending on their goals and strategy, and read the reviews about the indicator before buying it.
© Copyright 2022, All rights reserved