

Our partner, XM, lets you access a free demo account to apply your knowledge.
No hidden costs, no tricks.

MetaTrader 5 is a more advanced version of MetaTrader 4. Much like its predecessor, it offers traders numerous Forex trading indicators. While there are many built-in standard technical indicators available on MT5, you can get more custom-made indicators online.
“There is no single market secret to discover, no single correct way to trade the markets. Those seeking the one true answer to the markets haven’t even gotten as far as asking the right question, let alone getting the right answer.” - Jack Schwagger
But, what are the best MetaTrader 5 Forex trading indicators, and how can you use them? We are going to discuss exactly that in today’s guide.
When trading Forex, one of the main challenges for traders is to figure out what is going to happen next. Market analysis is a very important step towards success in the Forex trading market.
Out of the methods and tactics used to analyze the Forex trading market, one of the most popular methods used is technical indicators. These indicators are applied to the Forex trading charts directly in the trading platform, giving you detailed information about the price movements.
There are numerous trading indicators available on MetaTrader 5 and the best thing is that most of them are completely free.
"MetaTrader 5 is widely used and very popular in banking, trading on exchanges, and as well as in hedge funds" - Demis Gavrielides
Below, we are going to discuss the best free MT5 indicators and help you find the ones that fit your trading needs the best.
Moving averages are among the simplest types of Forex trading indicators. They span over a duration of time that can be as little as one minute or as much as 10 years. You can even create a simple and easy-to-follow trading strategy using only moving averages.
These indicators are primarily used to determine market trends, and they can also be used to identify the support and resistance levels in the Forex trading market. Among the most popular and most common moving averages are:
There is also another type of moving average available in the market called the moving average convergence divergence, MACD, which is a trend-following momentum indicator. But, more on that later.
When talking about MT5 indicators, moving averages are one of the first that comes to mind. These indicators are completely free, and you can download them from the official website of MetaTrader 5. In most cases, there is no need to download this indicator as it is usually directly coded into the trading platform. However, if your MT5 is missing it, you can easily get it.

The simple moving average is a commonly used MT5 indicator, which calculates the average of the selected price ranges. This indicator is mostly used to analyze the closing prices of the asset.
This indicator is used to determine the general conditions of the assets and whether the price will continue to increase, or if the trend is about to change.
SMA is among some of the best free MT5 indicators as it is very easy to use. The general idea behind using this indicator is to add the recent prices together and then divide the final figure by the number of time periods used. For example, let's say that you are analyzing the closing prices of the EUR/USD currency pairs over the past 5 days. This means that you are using the daily chart.
Let’s assume that the closing price of the currency pair on day one was 1.1221, on day two it was 1.1224, on day three 1.1220, on day four 1.1218, and on day five 1.1220. Your calculation would look something like this: 1.1221+1.1224+1.1220+1.1218+1.1220/5=1.1220. This means that the SMA equals 1.1220.
It is believed that short-term averages respond quickly to market changes, while long-term averages are slower to react. Also, keep in mind that you do not have to do the calculation on your own, that is the main idea behind using the top MT5 indicators - they do the hard job for you.
While similar to the SMA, EMA is a very different indicator. This type of moving average puts greater focus and significance on the most recent prices in the chart. This indicator is known for being able to react to recent price changes more than the SMA.
Like all other available moving average indicators in the Forex trading market, this indicator is also used by Forex traders to determine buy and sell signals. Traders can use different types of EMA lengths, including 10-day, 50-day, or 200-day moving averages to do their analyses.
On the MT5 indicators list, EMA is viewed as a great indicator for trending markets. When there is a strong and sustained uptrend in the Forex trading market, the EMA indicator can show traders a great deal of information that can be used to determine possible price movements.
Another very popular indicator in the Forex trading market is the “Moving Average Convergence Divergence”, more simply known as MACD. This indicator is known as a trend-following indicator, which shows traders the relationship between two moving averages to help them find trading opportunities.
Moving average convergence divergence can be calculated by subtracting the 26-period EMA from the 12-period EMA. This indicator can be used by traders to determine whether the bullish or bearish price movement in the market is strengthening or weakening.
In most cases, MACD is displayed using histograms. This indicator is used by a lot of traders around the world, making it one of the most popular indicators in the FX.
When talking about MT5 indicators available in the Forex trading market, one of the indicators that should not be forgotten is Bollinger Bands. This is a very popular technical indicator in Forex trading. This indicator can be used to determine the market conditions and to understand whether the asset is overbought or oversold.
While this indicator comes built-in with MT5, there are some versions of MetaTrader 5 that might not include this indicator. However, it is not something that you should be worried about. You can get this indicator very easily from the MT5 website and add it to your trading platform in just a few clicks.
When you apply this indicator to your charts, you will notice that there are three different lines shown on the chart. The middle band of the indicator is the regular simple moving average. As for the upper and lower bands, they are typically 2 standard deviations from the 20-day simple moving average. This can be modified by traders in case they have a specific strategy that calls for a modified version of Bollinger Bands.
Bollinger Bands is among the most accurate MT5 indicators, which makes it a very popular technical indicator among traders. Reading this indicator is very simple. The closer the price moves to the upper band, the more overbought is the market. The closer the price moves to the lower band, the more oversold the market is.
Among the MetaTrader 5 indicators that you should know about is Fibonacci retracement. This indicator helps traders to find the degree to which the market might move after the current trend.
Retracement in the Forex trading market happens when prices experience a temporary dip, also known as a pullback. Forex traders, who believe that the market is closer to making a move, very frequently use this trading indicator to confirm their suspicions.
Many Forex traders believe that Fibonacci retracement is the best trend indicator MT5 has to offer, as it offers you the opportunity to easily verify your ideas about the direction the market could take.
Fibonacci retracement can help traders determine the possible support and resistance levels in the Forex trading market, which is a great indicator for an upward or downward trend. You can use this indicator to understand where you should place limit orders, which can ensure safe and secure trading activity. This indicator can also be used to decide when to open or close a certain position.
Fibonacci retracement uses different types of horizontal lines that indicate possible resistance and support levels. Each level of this indicator is associated with a percentage, which indicates how much the prior move has retraced. For example, some of the Fibonacci retracement levels are 23.6%, 38.2%, 61.8%, and 78.6%.
This indicator can be drawn between any two significant price points. For example, you can use the high and a low of a certain asset to draw the indicator. The levels between these two price points are automatically created by the MT5 software.
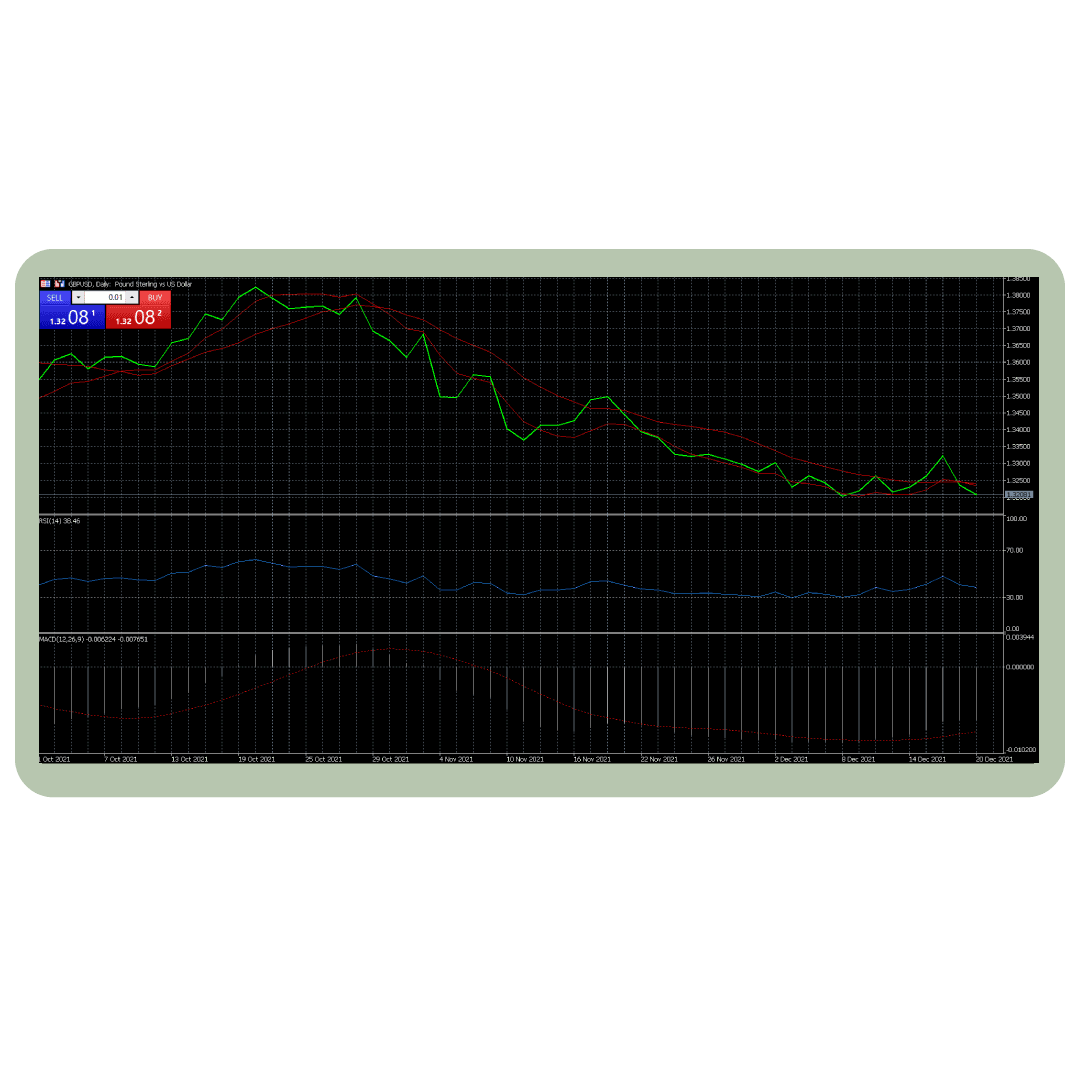
When talking about the best MT5 indicators in 2022, it is very important to not forget the Relative Strength Index, which is among the most popular Forex trading indicators in the market today.
This momentum indicator is very useful as it allows traders to measure the strength of recent price changes in the market, telling traders whether the market is in oversold or overbought conditions.
RSI is an oscillator, which means that it is shown in a special graph - usually below the trading chart - and moves between two extremes, from 0 to 100.
The most traditional way of interpreting this indicator is that when the value of the RSI is above 70, it indicates that the asset is overbought, or overvalued, and when the RSI indicator is below 30, it indicates an oversold or undervalued condition. The overvalued condition of the asset can be a sign that a trend reversal or corrective pullback is anticipated.
Many traders believe that RSI is the best free MT5 indicator as it can provide traders with very accurate market information that can help them determine their next steps.
The stochastic oscillator is another very popular momentum indicator that is used by traders to compare different types of closing prices of a certain currency pair.
This indicator is also used by Forex traders to determine oversold or overbought market conditions. Much like RSI, this indicator also moves between two extremes, 0 and 100, and is shown under the Forex trading chart in a special graph.
This indicator has been in use for a very long time, since the 1950s, and is among the most popular indicators today as well.
A traditional way of interpreting such MT5 indicators is that when the reading on the indicator graph is over 80, the market is considered to be in the overbought range. When it goes below 20, it is considered oversold. But, this does not always indicate an upcoming reversal.
If a trend in the market is very strong, it can be maintained at this overbought or oversold level for an extended period of time. Because of this, it is always a great idea to understand the strength of the trend before you make any decisions based solely on this one indicator.
When trading Forex, individuals are conducting extensive market research and analysis to find the best trading opportunities in the market. One method of analyzing the price movements in the Forex trading market is technical analysis, which is the process of analyzing the technical side of the market - i.e Forex charts.
To perform technical analysis, you will be using technical indicators, which are applied to the trading charts directly to give you information about the market conditions. The best MT5 indicators are able to provide traders with accurate and timely information about price movements, which can be used by retail traders to understand what is influencing the direction of the price.
On the other hand, some traders are using fundamental analysis, which is the process of analyzing financial and political events around the world that can have an influence on the Forex trading market.
Very frequently, Forex traders perform both fundamental and technical analyses when deciding which trades are best to make. You can very easily find the best MT5 indicators online and use these indicators to confirm the ideas that you have about the possible price movements in the Forex market.
Another way of using Forex indicators for free is to create one on your own. While this can be a complicated venture, there are many Forex traders in the market using MT5 custom indicators.
Our partner, XM, lets you access a free demo account to apply your knowledge.
No hidden costs, no tricks.
One of the best indicators for MT5 is the Relative Strength Index, simply known as RSI. This is a momentum indicator and is used in technical analysis for measuring the magnitude of the recent price changes in the market. It also helps traders to determine overbought and oversold market conditions.
Another very popular indicator in Forex is moving average convergence divergence, MACD, which is a trend-following momentum indicator that shows the relationship between two moving averages of a currency pair.
The original version of MetaTrader 5 comes with 38 technical indicators and 44 graphic objects pre-installed. You can very easily find the best MT5 indicator that fits your trading style from the list of built-in indicators, or you can easily find more online for free.
Adding indicators to MT5 is very easy. You should first download the trading indicator that you want to add to your MetaTrader 5. Then, go to File, click Open Data Folder, select Indicators, and paste the EX5 file in the folder. Close the trading platform and re-open it again, and you will be able to see your indicator in the Navigator window. Simply double-click the indicator to apply it to the chart and change the colors according to your personal preferences.
© Copyright 2022, All rights reserved