

Our partner, XM, lets you access a free demo account to apply your knowledge.
No hidden costs, no tricks.

Whether you prefer scalping, day trading, binary options, or any other trading approach, you will find the best MT4 indicators that fit your strategy listed right here.
The MetaTrader platform is full of indicators that are useful for every trader, and it can easily get overwhelming for traders to choose the right indicator for their trading style.
All MT4 Indicators give headlights on a certain price movement based on a series of calculations performed by the software. It is a part of technical analysis, which gives the trader information about the possible market direction.
“The core problem, however, is the need to fit markets into a style of trading rather than finding ways to trade that fit with market behaviour.” - Brett Steenbarger
Since many indicators can be used in the trading software, we will review the top free indicators that traders can use based on their different needs.
A scalping strategy relies on the buying and selling of several assets throughout the day and can also be done over the course of just a few minutes. Using this strategy, a trader does not hold the position for a very long time.
To be better informed about the anticipated price movement over this short time, there are some MT4 indicators that help traders execute the best possible orders, such as:
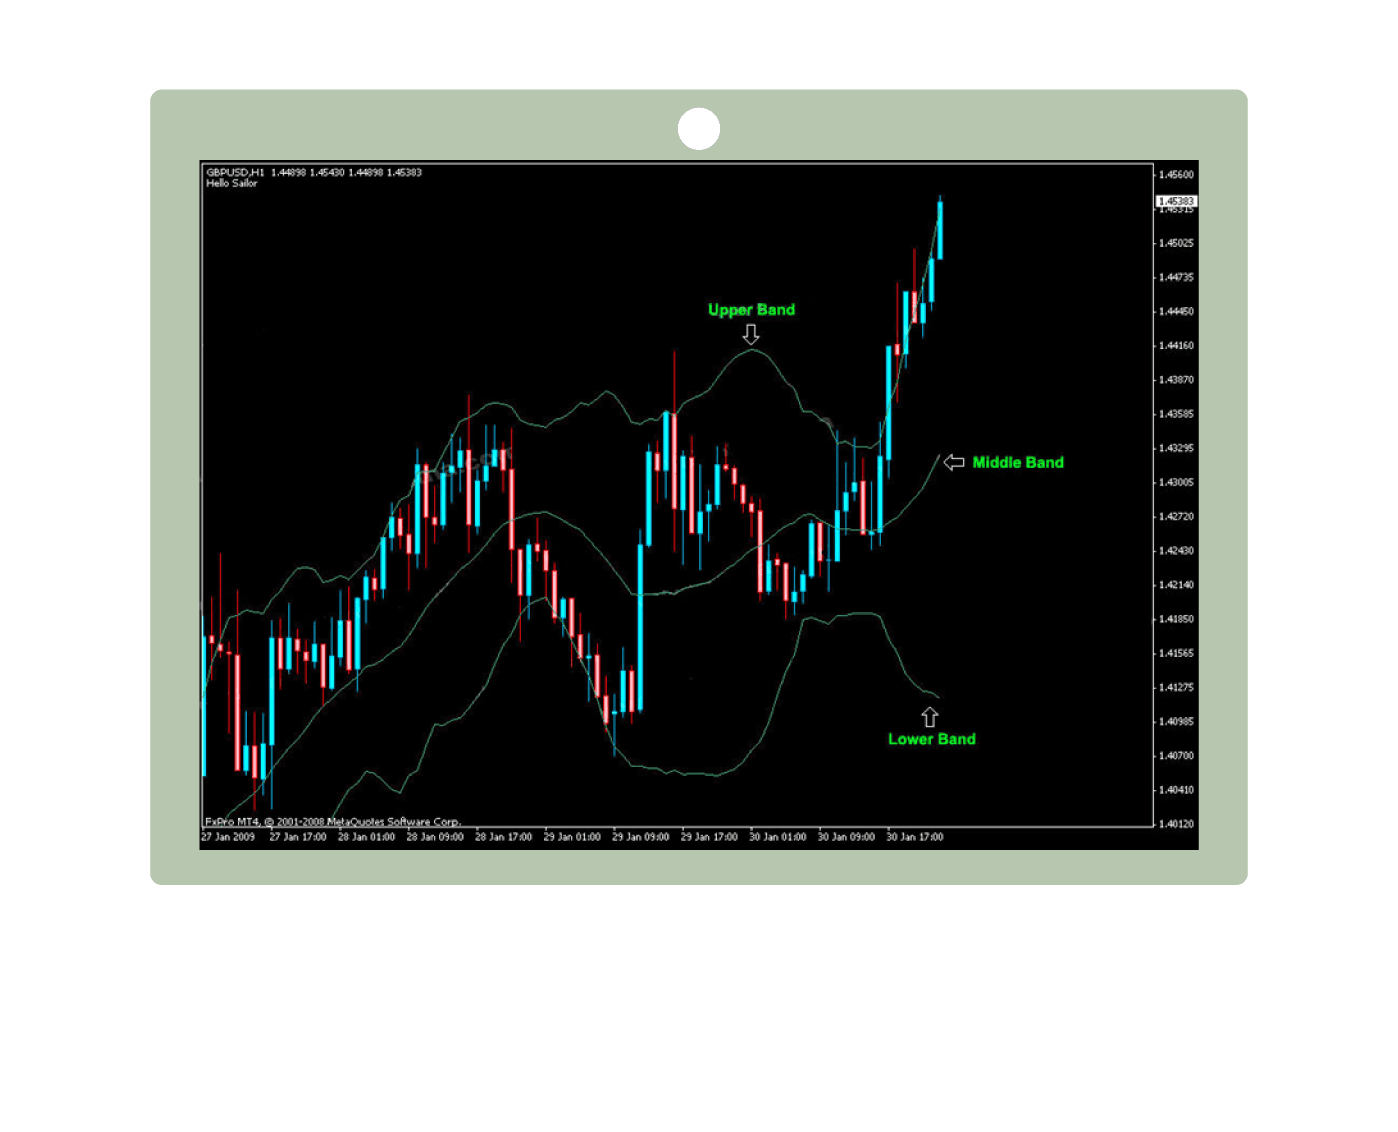
Bollinger Bands is one of the most popular indicators created by John Bollinger in the 1980s. This MetaTrader 4 technical indicator uses 3 bands that assist in reading the price movement and helps traders determine the market conditions.
The middle band represents the price movement of the asset.
The upper and lower bands contract and expand to represent the market volatility.
Here you enter the market when the market price is indicated with a flat band, or a straight line, which means that the market price is not sharply moving up or down.
When the middle band touches or comes too close to the lower band, it indicates a buy. This is held shortly until the middle band touches or comes close to the upper band, indicating a selling opportunity.
This indicator uses the average of the historical price movement, giving more weight to recent price changes, and based on that, the anticipated price trend is sketched out by the software.
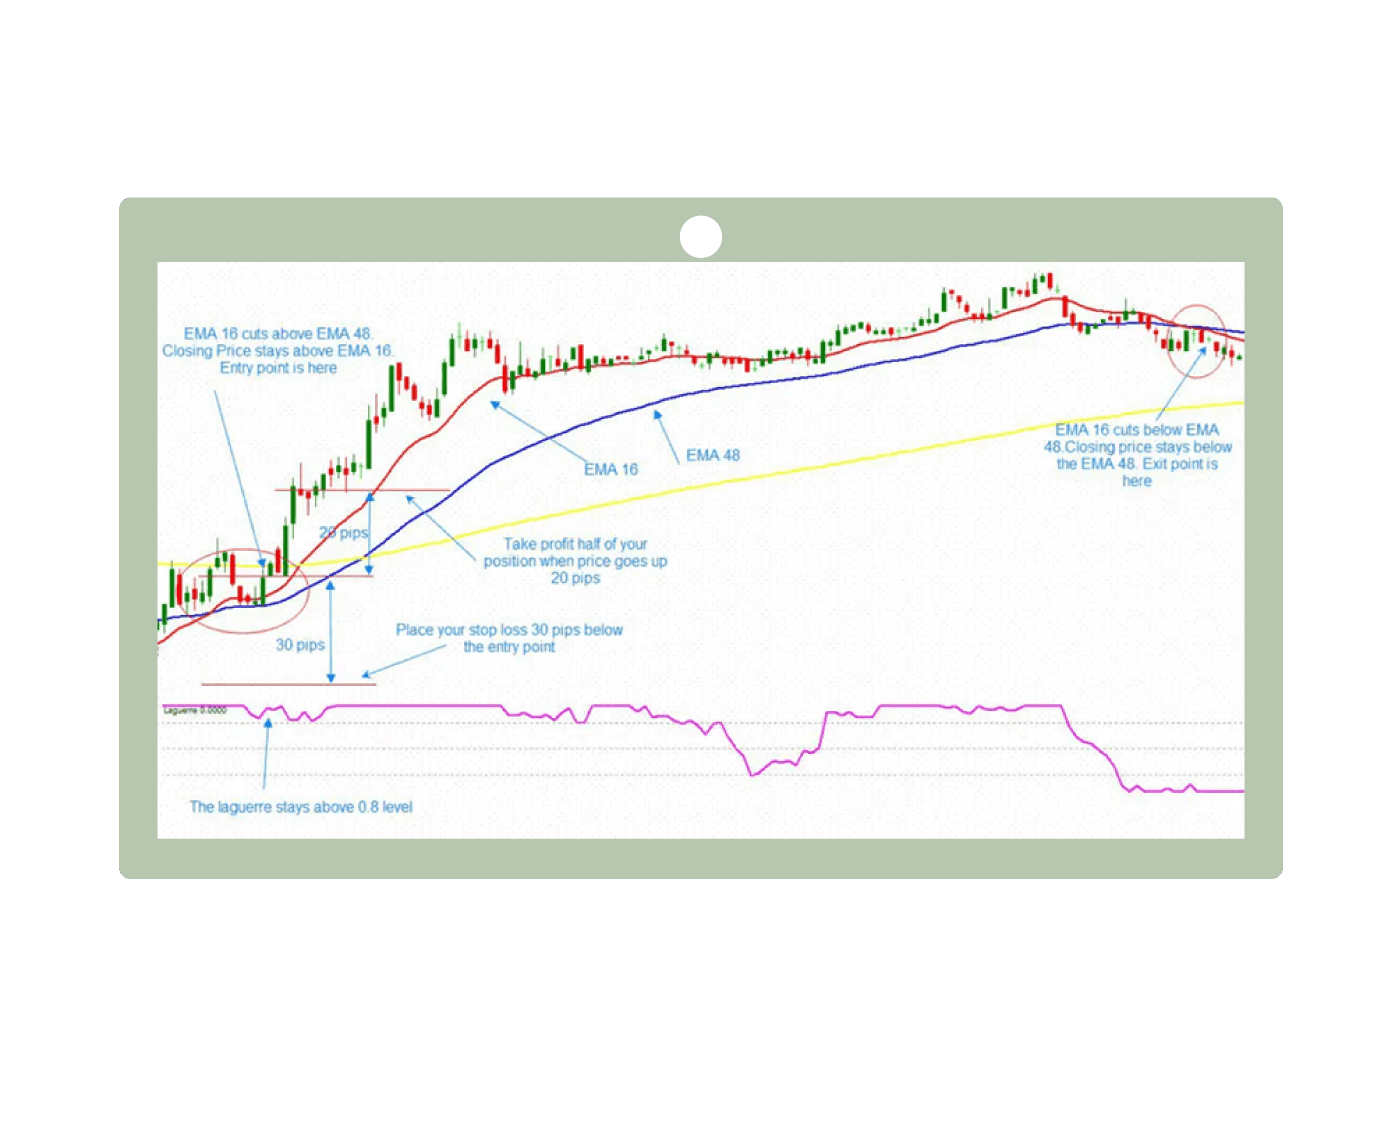
This MT4 indicator is an advanced variation from the classic moving average indicator. EMA provides a better picture since it considers the recent price changes at a higher value and gives more importance to them.
Some configurations should be set up beforehand, for example, the red line (fast MA) = 7 and the blue line (slow MA) = 14.
The entry point (buy order) using this indicator is when the red line approaches the blue line from below.
While the exit point (sell order) is when the red line crosses out from the blue line from above.
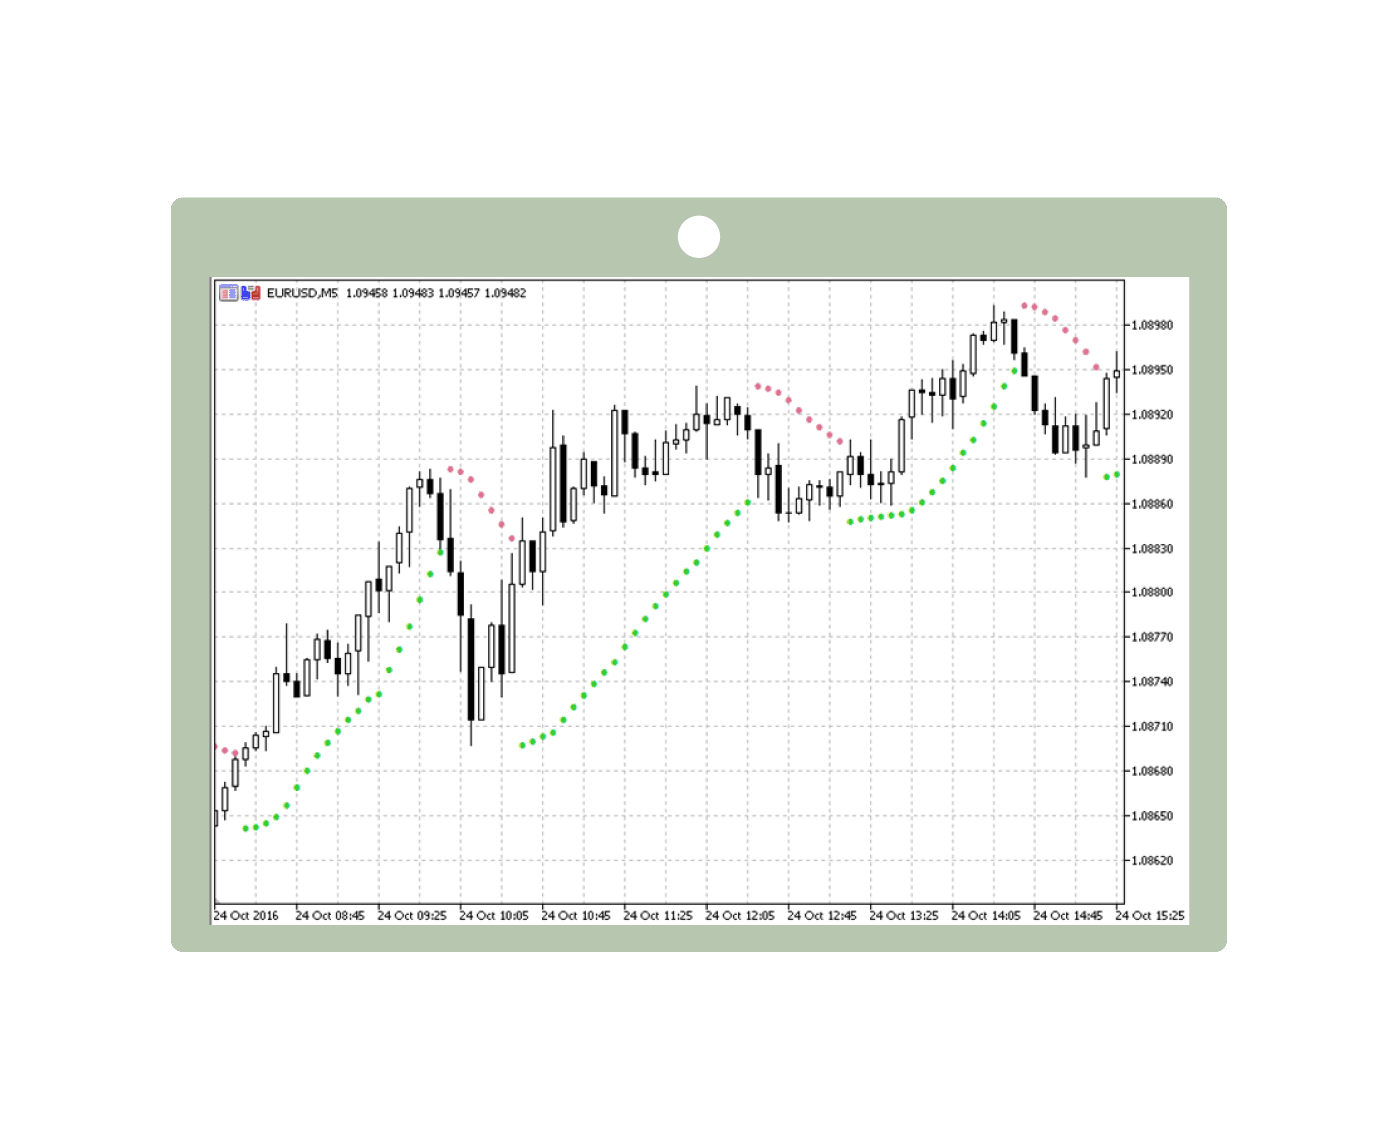
This free downloadable indicator for MT4 is a simple indicator designed for scalpers. It clearly shows the point at which the price trend is changing its direction.
Developed by J. Welles Wilder, this indicator uses technical analysis to predict potential price movements, and it depicts points over or below the price trend.
This MetaTrader4 indicator is either shown as green dots below the price trend indicating a buy option, or a bullish trend. On the other hand, if the price trend is bearish, the dots will turn red above the price trend, pointing out a selling opportunity.
Scalpers find it easy to use this MetaTrader indicator, because it visually shows the turning points and where the trader needs to buy or sell a market position.
Binary options are another trading strategy. Taking a binary option means that a trader places their money on the prediction that a certain asset will reach a certain price over a certain timeline.
When the timeline for that option expires, if the asset reaches the agreed price, the trader gains. However, if the time expires and the asset does not reach the price, the trader loses whatever he has invested.
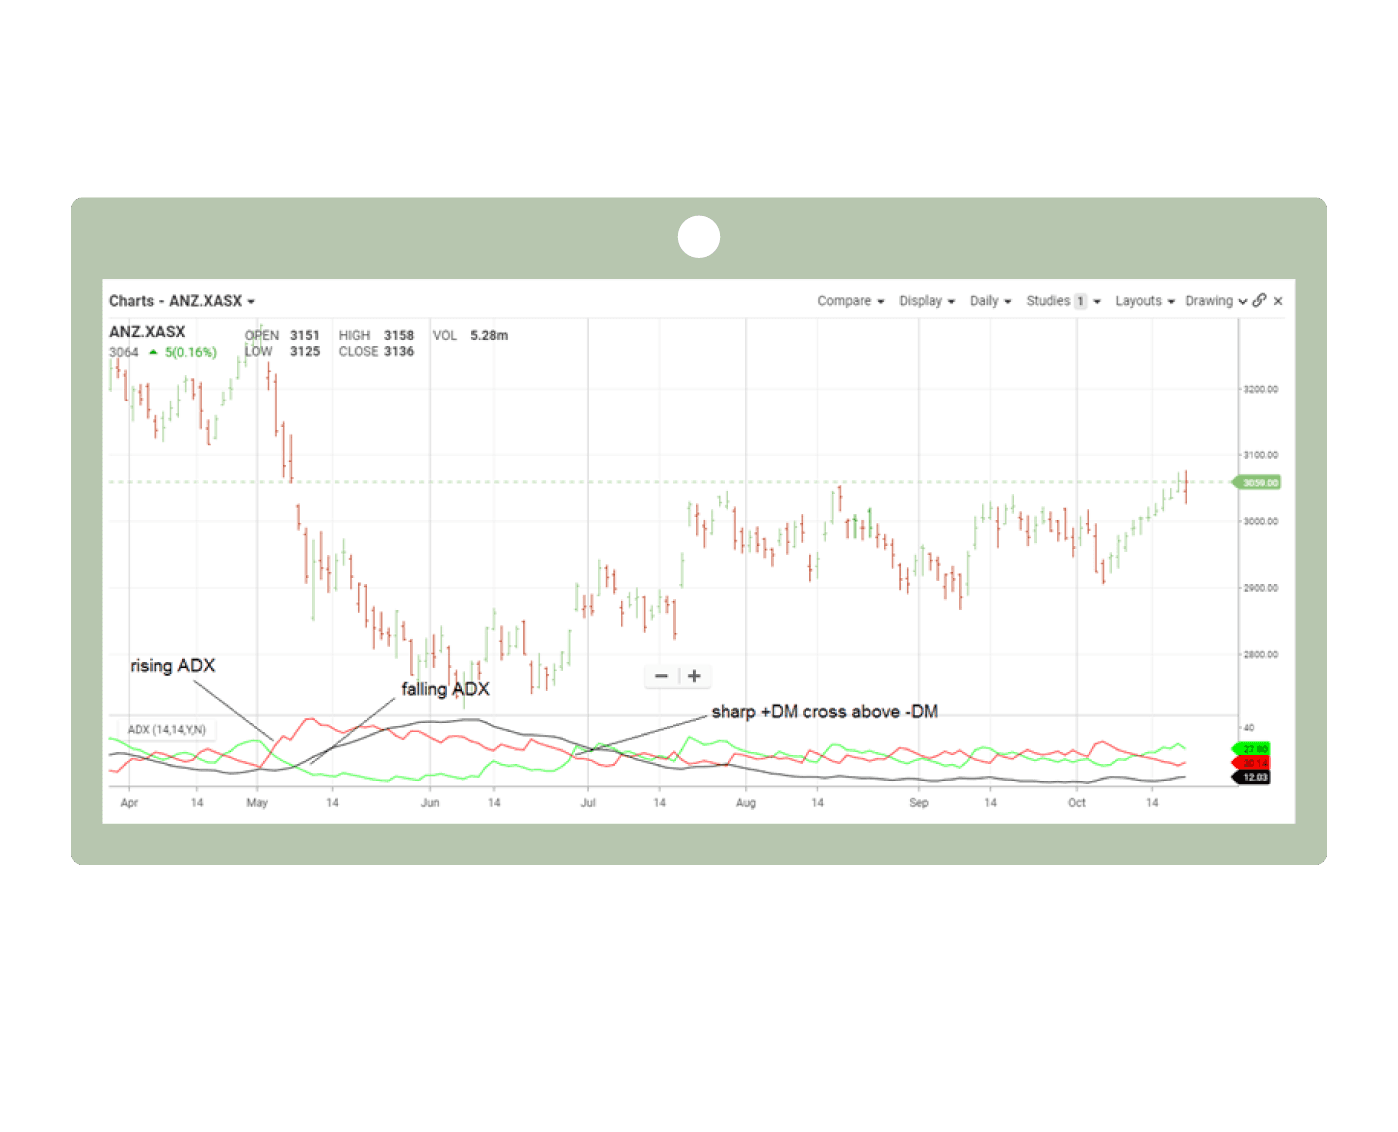
This indicator uses historical price highs and lows. What makes this one of the best indicators for binary trading in MT4 is that it determines the potential price movement and price direction. It is depicted using three lines that are shown on the chart.
Positive directional movement depicted as line DI+
Negative directional movement depicted as line DI-
While an average directional index is called ADX, which is the average between the uptrend and the downtrend.
The DI+ line is usually represented in green, the DI- line in red, and the ADX is shown in black.
So, when the DI+ is higher than the DI- it means that it is an uptrend movement, on the other hand, if the DI+ is below the DI-, it indicates a downtrend movement of the price.
Given that the software will automatically calculate the value of the ADX for you, the ADX can tell how strong/weak the trend movement is.
Thus, if the APX>25, it is a strong trend movement While if APX<25, it is an unstable trend movement.
This indicator focuses on predicting the closing price of a certain asset, and it uses a series of past periods that could be 14-days or 14 weeks.
It can be classified as one of the best MetaTrader indicators for binary options since it gives the traders a heads-up on the expected closing price, which is the main objective for a binary options trader.
This indicator will give the trader a reading that ranges from 0 to 100, and based on how high or low the number is, it will tell the trader whether the price will close on the high or low end.
Given this, if the indicator reads above 50, it means that the trend is within the upper side of the chart. Similarly, if the indicator is below 50, that means that trend is on the lower side of the chart.
Additionally, the Stochastic Oscillator indicator gives the trader a hint on the expected closing price of an asset, thus:
Another use of this widely used indicator in MT4 is that it can help you find the reversal point for the trend. This is the point at which the asset price trend changes its direction.
This can signal if the asset is overbought or oversold. When an asset is overbought, it means that it is being traded at a higher value than it should be, or higher than its fair value, and the price trend is likely to reverse its direction.
If the Stochastic Oscillator drops from more than 80 to below 50, the asset is overbought, and the price is likely to drop.
If the Stochastic Oscillator rises from less than 20 to more than 80, then the asset is oversold, and the price is likely to increase.
This indicator works similarly to Stochastic Oscillator, it calculates the predicted trend of an asset price, and gives the trader an idea about any overbuying or overselling of an asset.
If the trader is entering a new market and does not have experience with the trend movement in this market, this type of indicator comes in handy. It keeps the trader safe from being dragged into buying an overbought asset.
If the reading on the indicator is above +100, it dictates that a strong uptrend is starting. Meanwhile, if the reading of the indicator is less than -100, it means that a strong downward trend is starting.
Many traders still prefer the day trading strategy. This strategy envisages opening a position in the market at the beginning of the day and closing it at the end of the trading session.
We will be discussing the MT4 indicators that are used by most day traders.
These two indicators are the favorite of many investors who prefer day trading, let’s see in detail what each indicator does.
This indicator uses technical analysis from historic price changes, in order to predict upcoming price movements and price trends. RSI can be used whether the price has an upward or a downward trend.
This is one of the indicators in MT4 that tells the trader if the market is going to be overbought or oversold.
This MetaTrader 4 indicator gives a value of between 0 and 100. If the indicator is over 70, it means that the market is overbought.
On the other hand, if the indicator reads less than 30 it indicates that the market is oversold.
This is probably one of the most used and top MetaTrader 4 indicators because it helps the trader understand the way that the price is changing, and it simplifies the view for the traders looking at the trading software.
It substitutes the price fluctuations that a trader usually sees on the chart with a line that depicts the general direction and movement of the price trend.
This red line represents the moving average, which is calculated by summing the asset price over a certain period of time, then dividing the sum by the number of periods.
It gives the trader a clear view of the direction of the price trend. It is useful as it gives traders a better view of and control over their market positions.
Our partner, XM, lets you access a free demo account to apply your knowledge.
No hidden costs, no tricks.
From the navigation bar, click on “insert”, Then click the “Indicators” option. In this list, indicators are grouped according to the type and the influence on the chart. Choose the one you want and you are on your way.
Once you install Metatrader 4, you can have 6 types of indicators that are free, and you can add MetaTrader indicators straight from the marketplace free of charge.
However, some indicators used by top traders, are usually paid indicators, because they require a very advanced coding and programming process.
No, since the two pieces of software are written in different programming languages, the indicators are not cross-platform compatible.
Unless a developer re-writes the MT4 indicators in the same language as MT5, it will not work. It is something like Android and iOS, some applications do not run on both platforms because they are written in different languages unless a developer writes the app in both languages.
This should not worry you too much as both MT4 and MT5 have a vibrant community of developers that are constantly working on porting code from one platform to the other. So chances are that no matter what indicator you are looking for, there should be one available on whichever platform you choose.
© Copyright 2022, All rights reserved