Our partner, XM, lets you access a free demo account to apply your knowledge.
No hidden costs, no tricks.


Analyzing price data can be a challenging but important part of the trading experience. Technical indicators allow traders to measure different factors of an instrument by plotting them on the price chart and viewing the results.
The Stochastic Oscillator is one of the most popular technical indicators among traders and measures the momentum of the price change of an instrument.
It was developed by George C. Lane in the 1950s and is used by traders to generate overbought and oversold signals on a chart.
The Stochastic Oscillator compares a security's closing price to its price range over a specific period, typically 14 periods and consists of two lines - the %K and %D lines.
Traders use the Stochastic Oscillator to identify potential trend reversals or confirm existing trends.
The indicator ranges from 0 to 100, with readings above 80 considered overbought and readings below 20 considered oversold.
If you are a beginner trader and would like to know more about what the Stochastic Oscillator is and how it works in trading, this Investfox guide can help.
The Stochastic Oscillator is a momentum indicator that is plotted below the price chart and provides a value of between 0 and 100.
When the indicator shows an overbought condition, traders may sell or open short positions, and vice versa.
As already mentioned, the indicator consists of two main lines:
Consequently, the conditions identified by these two lines can be interpreted as follows:
It must be noted that relying solely on the Stochastic Oscillator is not a viable strategy, as the indicator can sometimes give off false signals, which can lead to substantial losses.
The Stochastic is often used in conjunction with the likes of moving averages and the Relative Strength Index (RSI0 in order to reduce the risk of false signals.
To better understand how the Stochastic Oscillator works in practice, let’s look at the indicator plotted below the price chart of Apple stock:
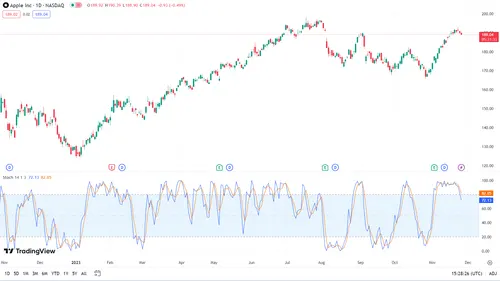
As we can see, major fluctuations in the changing values generated by the Stochastic coincide with the price shifts on the chart.
For instance, the trough visible in August was soon followed by a spike in the Stochastic, as well as a brief bullish run on Apple stock.
The chart shows reversals every time the Stochastic reaches a value of 80, confirming the overbought condition.
In general, analyzing a chart using the Stochastic Oscillator involves assessing overbought and oversold conditions to identify potential trend reversals or continuations.
Traders can use the Stochastic Oscillator on a wide variety of chart settings, including minute charts.
While a useful indicator, the Stochastic Oscillator comes with its fair share of limitations, which is why most traders tend to use it with the RSI and moving averages to reduce the risk of false signals.
Some notable limitations of the Stochastic Oscillator include:
It is important to take these factors into account when using the Stochastic while trading and analyzing price data.
Our partner, XM, lets you access a free demo account to apply your knowledge.
No hidden costs, no tricks.
The Stochastic Oscillator measures the closing price's position relative to its price range over a specific period. It generates a momentum indicator scaled from 0 to 100, identifying overbought and oversold conditions to signal potential trend reversals.
The Stochastic Oscillator is a widely used and respected tool, but its reliability depends on market conditions and proper interpretation. It can be effective when used in conjunction with other indicators and tools, but it's not infallible and requires careful consideration of its limitations.
Use the Stochastic Oscillator when identifying potential trend reversals in overbought or oversold conditions. It is most effective in trending markets and can be valuable when confirming signals from other indicators, providing a comprehensive view of market momentum.
© Copyright 2022, All rights reserved