

Our partner, XM, lets you access a free demo account to apply your knowledge.
No hidden costs, no tricks.

Anyone with working experience trading currency pairs will agree that FX trading involves significant amounts of technical analysis. Various indicators and chart patterns aid traders in getting ahead in the market and making profitable trading decisions. The FX market is the most liquid financial market in the world, which means that asset prices can sometimes move at breakneck speeds. This is why momentum indicators, or oscillators, are especially important for Forex traders.
The stochastic oscillator is one of the most widely used technical indicators among traders and shows the relationship between an asset’s closing price and its price range over a specific period of time. The indicator consists of two lines and when they cross/diverge, traders can use this information to generate buy and sell signals and act on them.
While it is true that no one indicator alone can provide consistently accurate buy and sell signals, the stochastic oscillator is an easy-to-use tool that can lessen the workload for traders - especially for those who trade on a 1-minute chart.
Before diving deeper into the practical side of using the stochastic oscillator on a 1-minute chart, it is crucial to understand how the indicator works and how it can be implemented on a 1-minute chart.
As already mentioned, the stochastic oscillator is a momentum indicator that measures the relationship between an asset’s price and its price range over a given period of time.
The oscillator consists of two lines - %K and %D. The %K line is the more sensitive of the two and %D is a moving average of %K. The two lines are typically plotted as a solid and dotted line, or in different colors.
When the %K line crosses above the %D line, it is considered a bullish signal, indicating that the momentum behind the asset's price movement is increasing. On the other hand, when the %K line crosses below the %D line, it is considered to be a bearish signal - indicating that the momentum behind the asset’s price movement is decreasing.
On a 1-minute chart, traders need to be more careful and it is best to choose a slower %K period to avoid false signals.
To apply the indicator to the chart of a given pair of currencies, users must first pick the stochastic oscillator from the indicator menu and select the %K, %D, and slow %K values for the stochastic to be applied properly.
While many traders use the 5, 3, and 3 values for stochastic oscillators, the 1-minute chart is highly sensitive and moves very quickly, which is why a lower %K value can prove to be wildly misleading and generate numerous false signals. To combat this, it is best to use a value of 14 as %K, while %D and slow %K remain at 3. A slower moving average reduces the risk of false signals.
Let’s see how the indicator looks when plotted on a chart:
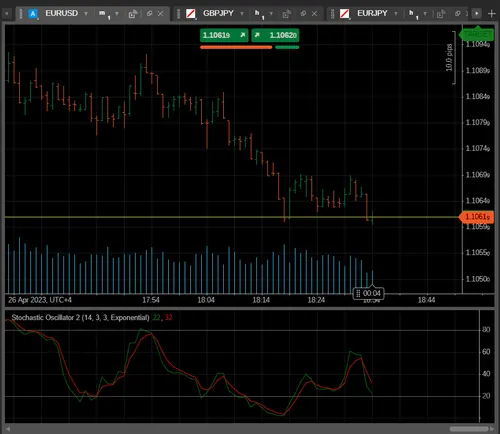
In this example, we can see the exponential moving averages crossing and diverging, which are used to generate buy and sell signals. The indicator shows where the market is overbought and oversold.
Using the stochastic for buy and sell signals is fairly simple; if the chart shows that an asset is overbought and the 1-minute oscillator is starting to turn down, this may be a good time to exit any long positions, as a downward movement in price is likely to occur.
As a rule of thumb, the general buy and sell signals on a stochastic 1-minute chart can be interpreted as follows:
These instances show that the momentum behind a buying/selling trend is slowing down and a reversal is likely. Traders can use this information to open short/long positions to make the most out of the opportunity.
While the stochastic oscillator may be a useful and widely-used technical indicator, it does come with its own set of pros and cons, which are heightened when used on a 1-minute chart, as it moves very quickly - causing the indicator to generate numerous buy and sell signals.
Our partner, XM, lets you access a free demo account to apply your knowledge.
No hidden costs, no tricks.
The stochastic oscillator can be a useful indicator for a 1 minute chart, as long as the %K line is slow, so it does not generate many false buy and sell signals.
To use the stochastic on a 1 minute chart, set the period for %K at 14 and the periods for %D and slow %K at 3. This can help prevent the indicator from generating false signals.
Buy when %K crosses above %D and sell when it crosses below.
Trading on a 1 minute chart can be risky, as the chart moves very quickly. However, with the right indicators and settings, traders can take advantage of many buy and sell signals and gradually increase their profits.
© Copyright 2022, All rights reserved