

Our partner, XM, lets you access a free demo account to apply your knowledge.
No hidden costs, no tricks.

The Forex market is a volatile place where prices move on a second-to-second basis. These movements might not be as big as cryptocurrencies, but people such as day traders and scalpers always find a way to make really good profits on these constant small movements. For this, they utilize different strategies, analyses, and indicators in order to receive the most accurate and up-to-date data on the market.
In Forex, short-term trading strategies mostly rely on information gathered from a 1 to 15-minute timeframe. There are many indicators that can be used for this strategy. Among them are moving averages, Bollinger Bands, and relative strength index. Let’s discuss how the best indicators for one minute chart work.
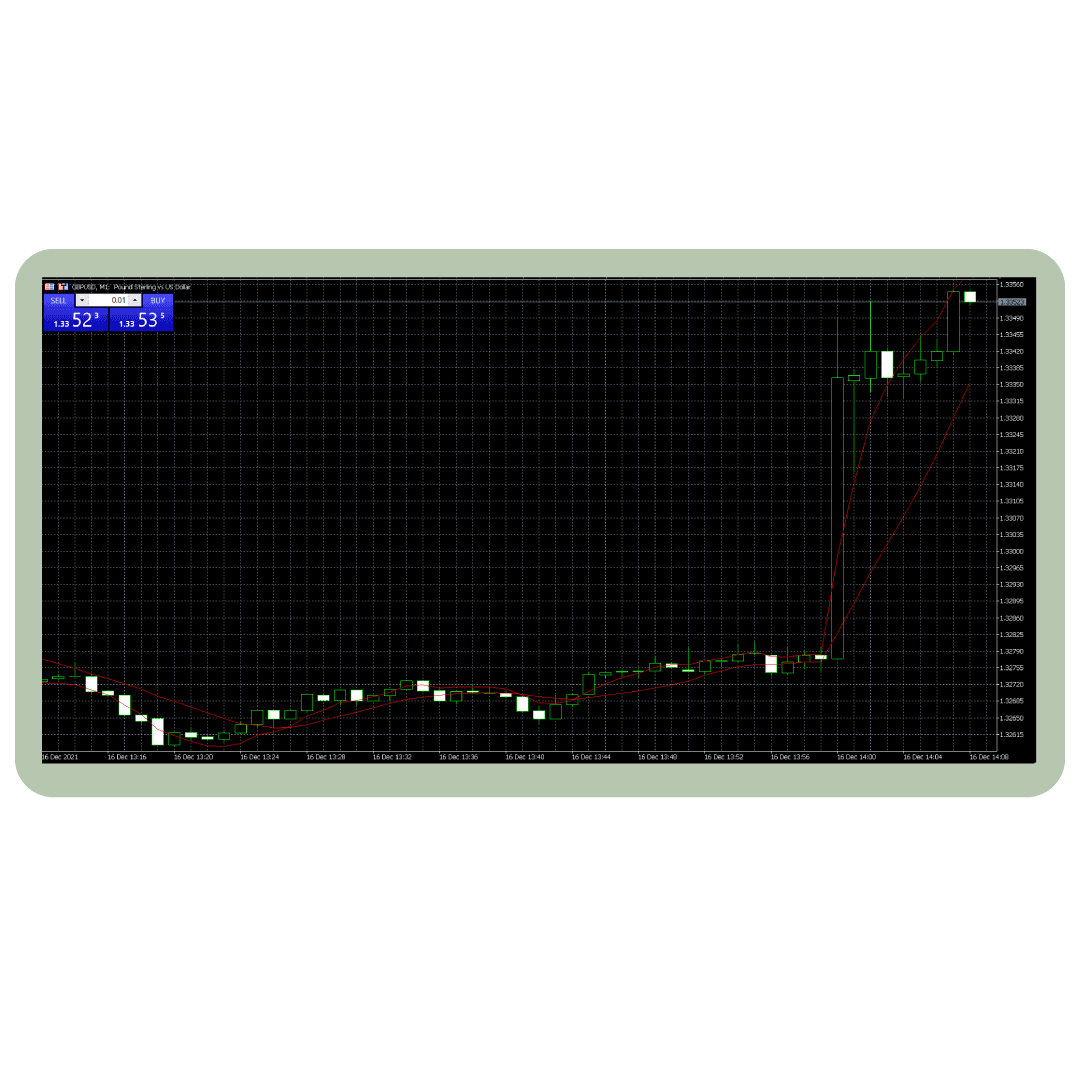
The exponential moving average, or EMA for short, is one of the most popular moving averages used by short-term traders. As it places a lot of emphasis on the most recent price movements, traders using the 1-minute chart can get a lot of value from the information that it provides.
Although this moving average indicated can be used with longer timeframes, most short-term traders apply a 7-period time frame to it. This helps them to even out the noise of small spikes and dips that occur in the market and allows them to focus on the general trend.
Let's use an example to illustrate the use of an EMA indicator. Say you are trading the EUR/USD currency pair and applied a 7-period EMA to your chart. The EMA will analyze data from the last 7 periods and produce show patterns of crossovers and divergences. From this information, you will be able to determine the best times to buy and sell in order to make a profit.
Among the best 3 indicators that you can use on 1-minute charts are moving averages, Bollinger Bands, and relative strength index. These indicators can be easily modified and tweaked according to your personal needs.
The single best indicator for 1-minute charts is the moving average, as it can very quickly respond to price fluctuations. However, there are some things you should know before you start using any of these indicators. So let's take a moment to look at them in a bit more detail.
The moving average, or MA for short, is one of, if not the most popular indicator used when dealing with 1-minute chart trading. Using these trading indicators can be quite useful for traders hoping to find the best trading opportunities in the market.
Whether you are looking for buy or sell signals moving averages can give you a good indication of where to enter the market.
With the help of this indicator, you can get information about the general trend. Not only is it good for short-term market analysis, but it can also give you information about long-term trends, which can be useful for planning your future positions.
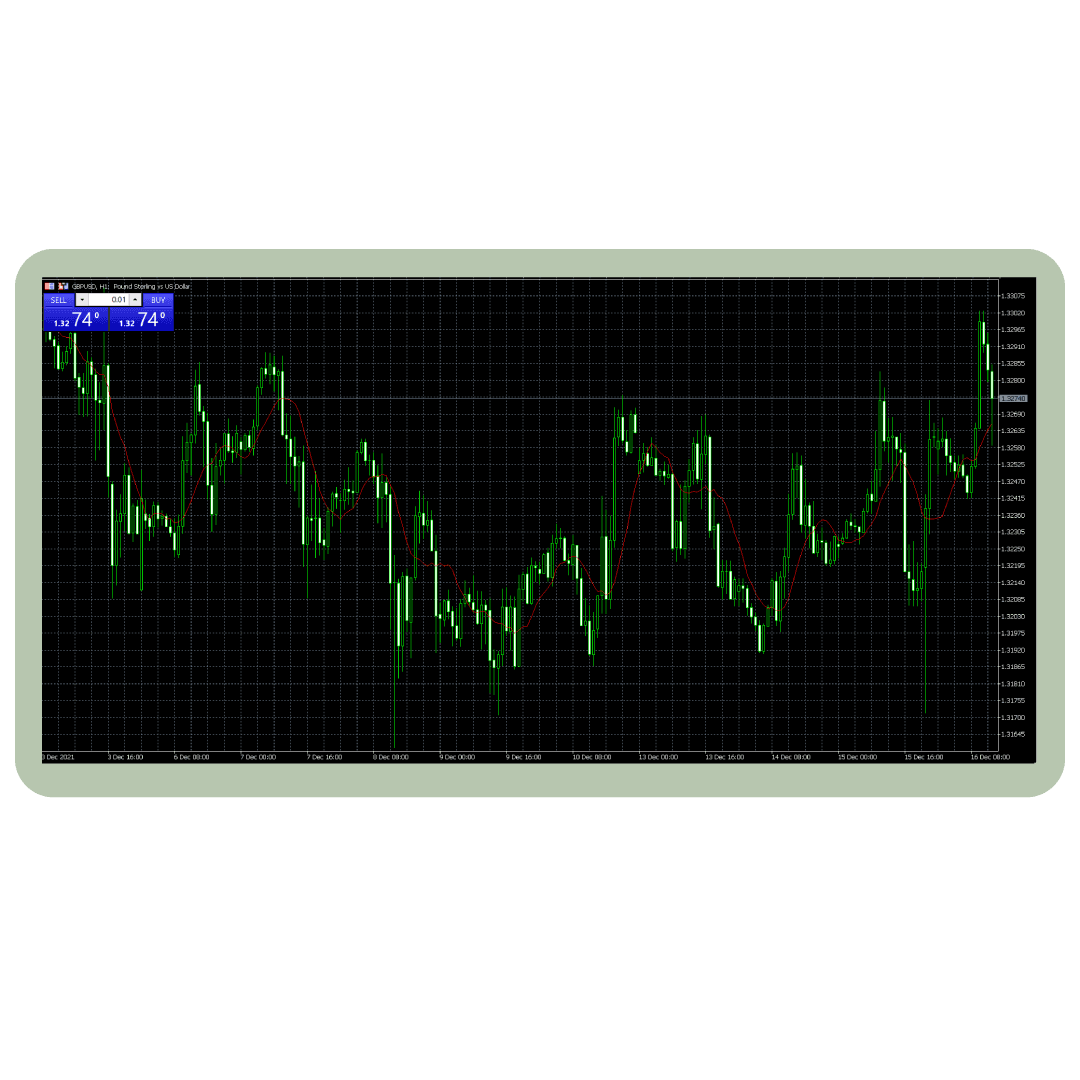
Lots of short-term traders are using a 7-period EMA along with 14-period EMA. This is a very popular way of analyzing the market among, especially for scalpers who use 1-minute chart information to trade from. Because of how quickly market conditions can change, moving averages are one of the best indicators for 1-minute trading and very useful for no-loss trading strategies. It can help you quickly receive information about the general trends in the market, which can be very helpful for making quick and timely decisions.
In general, a moving average is a very frequently-used trading indicator. It is known for smoothing out the price trends in the market and basically taking away the ‘noise’ from price movements. MAs can be constructed in different ways, and they can be used to analyze price movements over a number of different timeframes.
One of the most used Moving Averages among scalpers is the exponential moving average (EMA). This indicator is specifically designed to respond to price movements in a very quick and efficient manner.
Another very important and useful MA is the simple moving average (SMA). Let's say that you want to calculate the SMA of the EUR/USD currency pair over five periods. If the highs of the period for five days were: 1.16, 1.18, 1.17, 1.21, 1.15. Then to calculate the SMA, you will be adding these five numbers together and dividing them by the number of periods that they represent. In this case, we are using five prices from 5 periods. By following the formula, the SMA in this example would be 1.174.
When discussing the best indicators for 1-minute chart trading, Bollinger Bands is a definite contender for the top 3 places. When you look at this indicator, you will notice that there are three different lines. The top and bottom lines of this indicator are standard deviations, and the middle one is a simple moving average.
Because this indicator can be easily modified, it can be very useful for scalpers. It is mainly used to generate oversold and overbought signals in the market. When the price is closer to the upper line, or band, the market is more overbought. On the other hand, when it is closer to the lower band, the market is leaning towards being more oversold.
However, it should be noted that it is very hard to use Bollinger Bands on their own. Paired with other indicators, such as one of the moving average indicators or relative strength index, Bollinger Bands become much more useful for short-term trading.

The relative strength index (RSI), is a very famous indicator used to identify overbought and oversold conditions in the market. It is an internal strength index, which is adjusted very frequently. The value of this indicator ranges from 0 to 100. High RSI mostly occurs when the market increases fast. In the case of low RSI, it mostly occurs in the case of a market sell-off.
The main thing that makes RSI a good choice for short-term traders is that it can show you potential spikes or dips in the price, while it is very easily tweaked and changed according to the personal needs of traders.
It is always better to use RSI in conjunction with other indicators because on its own, especially in short time frames, it can be quite volatile, reaching extreme highs and lows very frequently. By watching the interaction of this indicator with the price, you can time your exit and entry point in a more precise way.
Tip 1 - Don’t waste time. When trading using one of the indicators we have mentioned, it is very important to make sure that you are not spending too much time analyzing the market. Scalping is a strategy that requires a lot of attention from traders and that relies on fast and decisive actions.
Tip 2 - Respond to your analysis quickly. Not only should you be able to analyze the market very quickly, but you also need to react to the analysis that you make in an efficient and fast manner.
Tip 3 - Use smart orders only when necessary. When it comes to using a 1-minute timeframe, the majority of traders mostly decide to execute trading orders manually. This helps to make sure that they do not waste too much time preparing stop-loss or take-profit orders. But, this does not mean you should avoid it all the time. During major economic announcements, limit orders can actually come in quite handy.
Tip 4 - Adopt an appropriate profit and loss ratio. For example, you can aim for a profit of 10 pips on each position you open and limit losses to 5 pips. It does not always have to be a 2:1 ratio but know what your aim is and trade accordingly.
Tip 5 - Use Heikin Ashi charts. Another very useful thing to do while trading on the 1-minute charts is to use a Heikin Ashi chart. This chart is a smoother version of the regular candlestick chart, and it offers traders the opportunity to receive market data in a more efficient and easy-to-understand manner.
“I know where I’m getting out before I get in.” - Bruce Kovner
Our partner, XM, lets you access a free demo account to apply your knowledge.
No hidden costs, no tricks.
The best 1-minute indicator is moving averages. This indicator can work perfectly for those who want to quickly and effectively analyze the market. SMA and EMA are two forms of moving average indicators that are often used in terms of 1-minute chart trading.
The simple moving average (SMA) generally tracks the average closing price over a specific period of time, while the exponential moving average (EMA) works in a similar way, EMA puts a lot more weight on the most recent prices in the chart. Both of these indicators are capable of quickly reacting to the latest changes in the market, which is quite an important thing for short-term traders.
While MACD is a very reliable indicator in the Forex trading market, it is not the best indicator to use when dealing with 1-minute charts. As MACD provides information on trend reversals, it works best over longer periods because short time frames have too much volatility.
© Copyright 2022, All rights reserved