

Our partner, XM, lets you access a free demo account to apply your knowledge.
No hidden costs, no tricks.
FX and CFD brokers have enjoyed a year of massive growth throughout the Covid-19 pandemic. With stay-at-home orders and stimulus checks, many newcomers entered the world of investments - consequently having a positive effect on the brokers’ bottom line.
The first Broker Snapshot by Investfox will look at the listed FX brokerages to determine the exact extent of changes in customer behavior throughout the post-pandemic investing environment. With rising inflation and fears of recession, investors are split between ultra-conservative and highly risky strategies.
The Snapshot will look at key financial metrics from Q12022 to see where these companies stand compared to their yearly performance and to each other.
It must be noted that the selection of brokers is from a broad pool and differences in regulatory requirements, currency and reporting periods can be observed.
Financial results will be denoted in native currency, while comparison data will be denoted in $US.
Overall, Plus500, XTB and StoneX Group (the company behind Forex.com and City Index) had an outstanding growth and market coverage, which will be discussed further in the relevant sections.
In this section we will compare the overall best performing brokers by key financial metrics and see how they hold up to the competition - who stands out and who lags behind. Measuring a stock takes considerably more information and ratios to consider, but the key figures such as revenue, EBITDA and EPS serve as a solid benchmark for assessing the brokers as businesses and measuring their overall financial performance.
The first metric to consider is the quarterly revenue. Here we will compare the brokers with notable revenue changes, as well as get a clear picture of the difference between company sizes and scope of business.
In terms of revenue growth, Plus500, StoneX Group and XTB stand out as they had a very positive dynamic YoY. It is important to note that CMC Markets was the only one with shrinking revenues, the reasoning behind which will be explained in the relevant section.
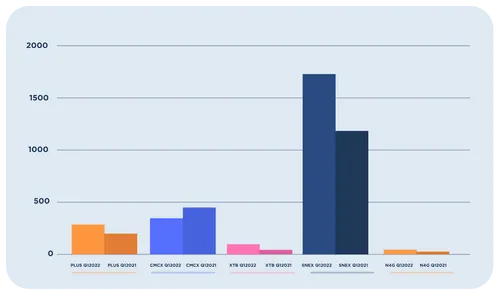
| Company | Q1 2022 Revenue ($US mln) | Q1 2021 Revenue ($US mln) | % Change |
|---|---|---|---|
| Plus500 (LON:PLUS) | 271 | 204 | 33% |
| CMC Markets (LON:CMCX) | 338 | 443 | (31%) |
| XTB (WSE:XTB) | 97 | 42 | 128% |
| StoneX Group (NASDAQ:SNEX) | 1640 | 1120 | 46% |
| NAGA Group (ETR:N4G) | 19 | 12 | 58% |
Measuring the financial position of a public company is impossible without considering the market capitalization. It is a metric that paints an interesting picture about both the size of the company and the investing community’s perception of its performance.
Certain stocks are profoundly overvalued, and their market capitalization is way above actual book value. When reviewing members of a certain industry, it provides a baseline which can be used to come up with an overview of the company’s history since its IPO as well as public expectations regarding their size and future performance.
In terms of our sample, IG Group is the largest of the bunch, while NAGA Group is a relatively smaller player both by market capitalization and revenue figures. Below we can compare the brokers by the investors’ perception of their size.
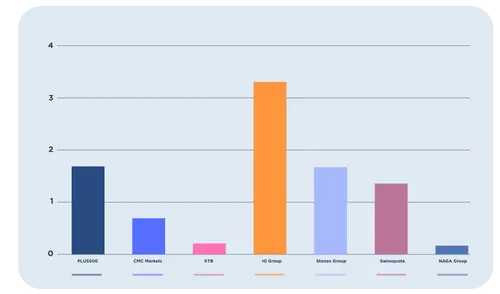
| Company | Market Cap. ($US bln) Jun 2022 | Market Cap Jan 2022 ($US bln) | % Change YTD |
|---|---|---|---|
| Plus500 (LON:PLUS) | 1.78 | 1.60 | 11.2% |
| CMC Markets (LON:CMCX) | 0.89 | 0.88 | 1.1% |
| XTB (WSE:XTB) | 0.54 | 0.42 | 28.5% |
| IG Group (LON:IGG) | 3.40 | 4.24 | (19.8%) |
| StoneX Group (NASDAQ:SNEX) | 1.56 | 1.27 | 22.8% |
| Swissquote (SWX:SQN) | 1.45 | 3.11 | (53%) |
| NAGA Group (ETR:N4G) | 0.14 | 0.41 | (66%) |
Leading the charge, Plus500 has had a stellar first quarter of FY2022, the UK-based CFD broker reported revenues topping $270mln, a 68% jump compared to the fourth quarter of 2021. WIth an even more impressive increase in EBITDA, up by a whopping 128% compared to the previous quarter, reaching over $161mln.
It is important to note that this increase is mostly riding on the rise of their average revenue per user, which is up by an amazing 64% compared to the previous quarter. Consequently, the explosive growth in customer acquisitions has died down - posting a modest 2% increase Q/Q, which in and of itself is down a somewhat alarming 62% YoY, amounting to 33,740 new customers this quarter.
With this promising financial news in mind, the board voted to re-elect CEO David Zruia who has been spearheading Plus500’s expansion towards new markets, such as Estonia and Japan. This push for expansion may or may not have been caused by the decline in active users, namely, by 35% YoY.
The company also reported the acquisition of Cunningham Commodities, expanding into the futures market, and the acquisition of EZ Invest Securities in Japan.
In other news, the company also announced their new marketing strategy featuring actor Kiefer Sutherland, as well as the appointment of Jefferies International Limited as Joint Corporate Broker.
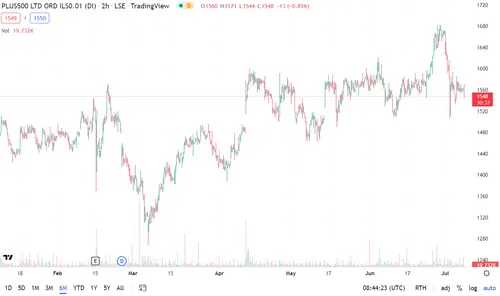
The acquisitions had an expected effect on Plus500’s stock price, which sunk to just north of 1300 GBX, but the Q1 report and the positive financial results triggered a buying spree, raising the price up to 1590 GBX.
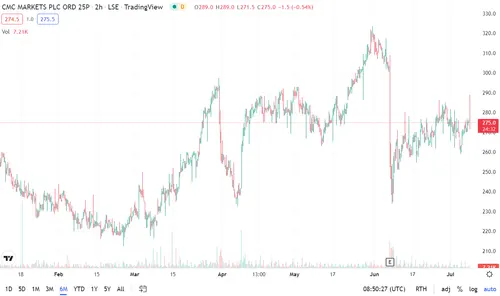
Coming up, CMC Markets, the UK-based CFD and FX broker has had an incredibly disappointing year. The company posted a 31% reduction in net operating income, as well as more than half its prior year EPS.
However, despite the numbers coming up short compared to the previous year, it is important to consider that much of that reduction was due to markets normalizing after the pandemic-fueled boom in financial markets.
With fears of inflation and general market uncertainty, traders tend to be more conservative with their funds - hence the sharp decline in the company’s bottom line.
Another factor to consider from CMC’s annual report is the guidance and slashing of dividends.
Company CEO Peter Cruddas cited growth as CMC’s current prime objective and targeted 30% growth in net operating income across three years as a strategic milestone set for the business.
While the numbers themselves are far from stellar compared to the previous year, it must be considered that much of CMC’s bottom line is dependent on client activity, which was unusually high during the pandemic due to lockdown measures across the world, coupled with stimulus checks handed out by governments.
The stock price had been cratering towards the start of the year, but the forward-looking statements helped bolster shareholder confidence in the company long-term. The stock rose from 220 to 290 GBX towards the end of March 2022.
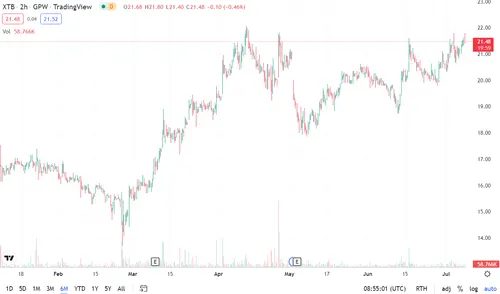
XTB, the Poland-based CFDs and forex broker enjoyed a very strong start to 2022. With total operating income more than doubling and net profits almost tripling, XTB is well-positioned to have a historic fiscal year in 2022.
This explosive growth is coming off the back of solid customer base growth coupled with solid trading performance. CFD trading has gained special traction, with trading volumes surpassing 1.5 million from 1.1 million in Q12021.
This stellar financial performance did not go unnoticed by the investing community. With share prices rising from around 14 to over 20 PLN over the course of one quarter has primed Xtb as one of the most exciting growth companies in Poland.
XTB is actively seeking expansion in South Africa. The South African subsidiary has been undergoing the licensing process for two years, which will allow XTB to provide FX and CFD products to clients outside South Africa as well.
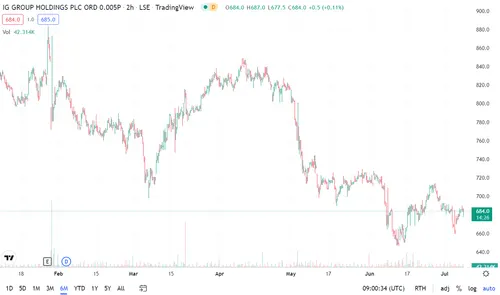
IG Group’s Q3 report for the quarter ending 28 February did not contain too many surprises. Decent revenue growth of over GBP 30 million positions the company well to fulfill guidance figures in the short term.
Revenue growth from high potential markets powered by the expansion of IG Group’s trading platform Tastytrade will likely continue to be a driving force for the group.
Stock price performance-wise, IG Group has seen a 15% drop compared to the previous quarter, and with solid margins and an EPS of 1, the company is positioning towards more growth, and as the stock price fluctuates, it might trigger new investor onboardings with middle to long term gains in sight.
The stock is currently trading lower than the high of 840 GBX in April to hovering around 670 GBX in June.
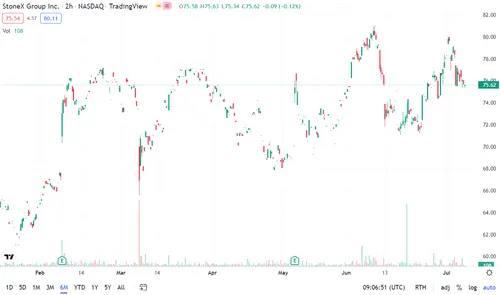
Coming up, NASDAQ listed derivatives broker StoneX Group (NASDAQ:SNEX) saw its gross revenue increase by over $2bln compared to the quarter ending December 31 2021, marking an impressive 46% increase YoY.
Operating revenues have also increased by almost $95mln compared to the previous quarter, with the CEO Sean M. O’Connor stating that the commercial and retail segments both yielded positive growth for the company’s bottom line.
Speaking of bottom line, net income figures are also up, both compared to the previous quarter and year-over-year. The figure posted by the company, amounting to $64mln, sees over a 50% gain compared to the previous quarter.
Thanks to the increased earnings, the earnings-per-share is also up to $3.18.
This positive trend in the annual statements has not gone unnoticed by the investing community, with the share price rising from $61 in January to $77 in March.
With solid growth and a healthy financial position, the shareholders seem to be happy by the direction StoneX is headed.
One factor that some investors may find troubling is the comparatively low net income figure when compared to the company’s gross revenue and operating income figures.
A part of the securities brokerage industry for well over a decade, StoneX still continues to grow and capitalize on new opportunities across the financial services market. With over 52,000 commercial and 370,000 retail customers, StoneX have proved themselves to be a business oriented on growth and new opportunities.

The Swiss banking group Swissquote is yet to publish their quarterly report for 2022 and the stock price has seen a steady decline since the start of the year. Down from the high of 173 CHF, the stock is currently trading below 95 CHF, with investors patiently awaiting the results for Q12022 and as the upside momentum is dying down, the report will play a crucial role in things to come for the stock before FY2022 comes to a close.
While financial information is scarce, the company has been making strides in other areas, signing a cooperation agreement with Leonteq to deliver structured products under the brand name “Yield Booster”, which aims to enhance the trading experience and improve transparency for Swissquote customers.
In other news, the SIX Exchange Regulation launched an investigation against Swissquote on the basis of a potential violation to ad hoc publicity.

Social trading platform NAGA have announced quarterly revenue figures of EUR 18mln - a sharp increase YoY for the growing holding company which incorporates a neo-banking, brokerage and crypto trading platform.
CEO Benjamin Bilski shared a positive outlook regarding the company’s future prospects and also shared the plans to start reporting for NAGA’s three aforementioned business divisions separately.
NAGA is also actively seeking licensing as a crypto asset service provider across Europe and Southeast Asia, with a few strategic acquisitions in the pipeline.
The company’s stock price had been in decline since the start of the year, which took a turn for the better in March, gaining around 50% towards the end of the month.
A relatively new player in the financial services industry, NAGA group still has a long way ahead to reach the scale of some of the industry leaders, but if these financial results are anything to go by, the company seems to be in solid financial health and growing at a reasonable rate.
The CFD and FX brokerage industry has had a mixed start to FY2022. While certain companies such as StoneX and XTB enjoyed a steady growth through Q1, most companies had a shaky performance that left much to be desired.
Since the immediate dangers of the Covid-19 pandemic subsided and the rising inflation caused fears of a global recession, investors have been more frugal with their funds and this was evident in the financial reports of most brokers. Declining revenue and modest guidance means the industry as a whole is adjusting to a changed reality where investors are much more selective with their assets of choice and with government stimulus drying up, this trend will likely remain, at least in the short term.
This snapshot aimed to provide an overview of some industry players from around the world, both large and small and to create a rough estimate of where these companies and subsequently, their stock, might be headed.
© Copyright 2022, All rights reserved