Triangle Trading Strategy Explained For Beginners

Triangle Trading Strategy Explained For Beginners

Technical analysis is an integral part of trading on the forex market. Traders use a wide variety of indicators to find patterns on the chart and identify potential entry and exit points for their traders. 

One such popular chart pattern is called the “triangle”. The triangle is a continuation pattern that shows the reinforcement of an existing trend after a short period of consolidation. 

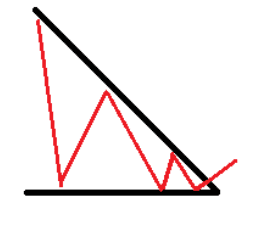
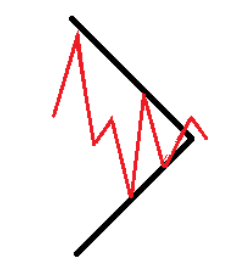
There are three types of triangle patterns - ascending, descending, and symmetrical. 

These patterns help identify a slowdown in a market trend and indicate whether it will continue upwards, downwards or sideways. 

Triangle pattern strategies are especially popular for major currency pairs, which are more liquid and pattern formations are stronger. 

Traders enter the market when the price breaks out of the triangle pattern, which marks the point when the price is expected to swing up or down. 

The principle behind the triangle strategy is that markets exhibit repetitive patterns and by recognizing these patterns, traders can make informed decisions about when to enter or exit positions, set stop-loss orders, and manage risk effectively.

How The Triangle Trading Strategy Works

To understand how the triangle trading strategy works, it is important to understand that there are three distinct scenarios and triangle patterns that indicate a bullish or bearish trend, or market indecision. 

These indicators are crucial in understanding what part of the trend has already formed and where the price might be headed in the near future. While triangle patterns might not always generate exactly correct signals, they can nonetheless be useful in visualizing trend boundaries. 

Ascending Triangle

ascending.png

  • Bullish Continuation: An ascending triangle typically indicates a bullish continuation pattern. It suggests that there is a strong likelihood that the existing uptrend will continue
  • Accumulation: The pattern may signify that buyers are accumulating positions at higher levels, leading to higher lows, while sellers are being consistently pushed back by resistance
  • Anticipated Breakout: Traders often anticipate a breakout to the upside when the price approaches the apex of the triangle. This breakout could lead to a further upward price movement
  • Price Target: Traders may set a price target for their trade by measuring the height of the triangle and projecting it upward from the breakout point

Descending Triangle

descending.png

  • Bearish Continuation: A descending triangle typically indicates a bearish continuation pattern. It suggests that there is a strong likelihood that the existing downtrend will continue
  • Distribution: The pattern may signify that sellers are accumulating positions at lower levels, leading to lower highs, while buyers are consistently pushed back by resistance
  • Anticipated Breakout: Traders often anticipate a breakout to the downside when the price approaches the apex of the triangle. This breakout could lead to a further downward price movement
  • Price Target: Traders may set a price target for their trade by measuring the height of the triangle and projecting it downward from the breakout point

Symmetrical Triangle

symmetrical.png

  • Indecision: A symmetrical triangle indicates a period of indecision in the market. Buyers and sellers are roughly balanced, and neither side is clearly dominating
  • Potential Reversal or Continuation: Symmetrical triangles can lead to either bullish or bearish breakouts. Traders look for additional confirmation or use other technical indicators to help determine the likely direction of the breakout
  • Anticipated Breakout: Traders wait for a breakout in either direction and may use trendlines or other indicators to help identify the direction of the impending move
  • Price Target: Similar to the other triangle patterns, traders may measure the height of the triangle and project it in the direction of the breakout to set a price target

Using The Triangle Pattern For Trading

Now, we can look at when traders enter positions after a triangle pattern has formed on a price chart:

  • Ascending: Traders enter a position when the price breaks above or below the ascending triangle. If the price reaches above the horizontal resistance level, traders may buy, and sell if the price falls below the lower trendline. To mitigate risks, traders place a stop-loss on the opposite side of the triangle
  • Descending: Traders open short positions when the price breaks the lower trendline. When the price breaks out of the descending triangle, they may choose to buy. The upper resistance trendline is used as a stop-loss level for short-sellers 
  • Symmetrical: The symmetrical triangle is used as a confirmation of an existing bullish/bearish trend. The price target for a breakout or a breakdown can be determined by calculating the distance between the high and low of the previous part of the pattern

Pros And Cons Of Using The Triangle Trading Strategy

The triangle pattern strategy comes with its fair share of advantages and disadvantages, which are important to consider when applying the technical patterns on a chart. 

Pros 

  • Clear Price Levels: Triangle patterns provide well-defined support and resistance levels on price charts. This clarity can assist traders in setting precise entry, stop-loss, and take-profit levels, making risk management more effective
  • Objective Technical Analysis: Triangle patterns are based on technical analysis and historical price data, making them relatively objective. Traders from various backgrounds can use these patterns to identify potential trade opportunities without relying heavily on subjective indicators
  • Predictive Value: When confirmed, triangle patterns often indicate a high probability of future price movements. Traders can use these patterns to anticipate breakouts and trade in the direction of the expected move, potentially leading to profitable opportunities

Cons

  • False Breakouts: One of the significant drawbacks of triangle patterns is the potential for false breakouts. Sometimes, the price may briefly break out of the pattern but then quickly reverse, leading to losses for traders who entered positions based on the breakout
  • Subject to Market Conditions: Triangle patterns may not work well in all market conditions. They are most effective in trending markets, and their reliability can diminish in ranging or choppy markets where price movements lack clear direction
  • Complexity and Interpretation: While the concept of triangle patterns is straightforward, their interpretation can be nuanced. Traders may differ in their views of when a breakout is confirmed or which direction it will take. This subjectivity can lead to confusion and potentially incorrect trading decisions

Key Takeaways From Triangle Trading Strategy Explained For Beginners

  • The triangle pattern is a technical pattern used in trading that consists of horizontal support and resistance lines which form the shape of a triangle 
  • There are three types of triangle patterns - ascending, descending, and symmetrical
  • The ascending triangle shows a possible bullish trend, the descending triangle shows a bearish trend, and the symmetrical triangle shows indecision on the market 
  • The triangle pattern can sometimes generate false signals, which is why it is not advisable to rely solely on its support and resistance lines 

FAQs On The Triangle Trading Strategy

What is an ascending triangle in trading?

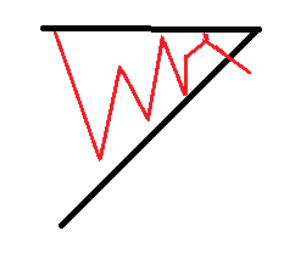
An ascending triangle in trading is a bullish continuation pattern characterized by a horizontal resistance level and an ascending support line. It suggests that buying pressure is increasing and may lead to an upward breakout.

Is the triangle strategy any good?

The triangle pattern strategy can be effective when used alongside other technical analysis tools and risk management. Its reliability depends on market conditions and confirmation signals, making it a valuable tool for some traders but not foolproof for all situations.

How does the triangle trading strategy work?

The triangle trading strategy works by identifying specific chart patterns, such as ascending, descending, or symmetrical triangles. Traders use these patterns to anticipate potential price breakouts. Buy or sell orders are placed near the breakout points, with stop-loss and take-profit levels to manage risk and capture potential gains.