Our partner, XM, lets you access a free demo account to apply your knowledge.
No hidden costs, no tricks.


Technical indicators play an integral role in many trading strategies. Indicators give traders the ability to analyze trading data on price charts to make decisions in accordance with the generated signals.
The MACD, short for Moving Average Convergence Divergence, is a commonly used technical indicator that consists of the MACD line and a signal line.
Traders use this indicator to look at the crossovers and divergences of the two lines to generate buy and sell signals and act on them wherever applicable.
The indicator was developed by Gerald Appel in the late 1970s and quickly became a popular indicator among forex and stock traders.
The relationship between the signal and MACD lines is the core concept behind the MACD indicator, and both lines are represented by exponential moving averages of different periods.
If you are a beginner trader and would like to know more about what the MACD indicator is and how it is used in trading, this Investfox guide can help.
As already mentioned, the MACD indicator consists of two lines, the signal line and the MACD line.
Here’s how each of the lines typically work:
Additionally, the MACD indicator often includes a histogram, which represents the difference between the MACD line and the signal line.
The indicator is typically plotted below the price chart of an instrument and shows crossover and divergence patterns between the two lines to generate signals.
Here’s how traders typically interpret the signals generated by the MACD:
It is important to note that relying solely on the MACD to generate accurate signals is typically not enough over the long term. Traders typically use additional indicators with the MACD, such as Bollinger Bands and the Relative Strength Index (RSI).
To better understand how the MACD indicator works in practice, we can look at an example of the indicator plotted below the price chart of Apple Inc stock (AAPL):
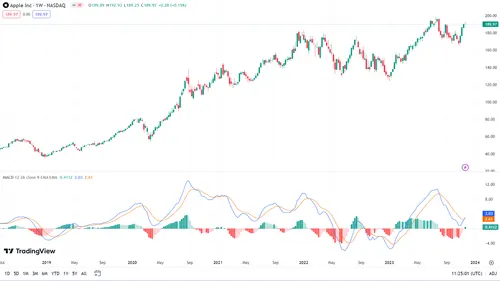
As we can see, the MACD and signal lines show convergences during periods of major price movements of the chart. As the MACD is a commonly-followed indicator, traders can anticipate some price movements with this method, as there is a high degree of correlation between the movements of the MACD and the price chart.
When the histogram turns green, the price is likely to climb, and fall when the histogram turns red. When the MACD and signal lines converge, this can be seen as a buy signal, while divergences show sell signals.
Our partner, XM, lets you access a free demo account to apply your knowledge.
No hidden costs, no tricks.
The Moving Average Convergence Divergence (MACD) is a momentum indicator in technical analysis. It consists of a fast and slow Exponential Moving Average (EMA) relationship, generating signals through crossovers and histogram analysis to identify potential trend reversals and strength.
The MACD is widely used and considered reliable by many traders for identifying trends and momentum. However, like any indicator, it's not foolproof, and traders often use it in conjunction with other tools for more comprehensive technical analysis.
Traders use the MACD indicator to identify potential trend reversals and gauge the strength of price movements. Crossovers between the MACD line and signal line signal buying or selling opportunities, while divergence and histogram analysis provide additional insights into market momentum.
© Copyright 2022, All rights reserved