

Our partner, XM, lets you access a free demo account to apply your knowledge.
No hidden costs, no tricks.

In technical analysis, there is a dedicated type of analysis called chart patterns. Chart patterns occur when price action draws certain shapes on the chart. One of those patterns is called M Formation or double top formation and is widely used by experienced technical traders. When used correctly, it can provide highly accurate trading signals. Let’s dive into this and find the best-case scenarios for detecting, confirming, and trading based on the M Formation.
Chart patterns are formations occurring on the price charts, and they can be candles or any other type of chart. The main idea is that price action creates figures or formations that can be used to analyze the current price behavior and draw conclusions about whether the price is going to continue in its current direction or not. They can be observed on various types of charts and are not limited to candlestick charts. Candlestick patterns, on the other hand, are specific figures created by candles on a candlestick chart.
As we will be focusing on candlestick charts, here are some chart and candle stick patterns that you might see.
Popular chart patterns include:
Popular candlestick patterns are:
These patterns are all useful, but traders have to use them in conjunction with other confirmation factors to increase the success rate. No single pattern provides a high-accuracy signal without confirming it with other technical indicators.
An M Formation is a bearish reversal pattern and its more popular name is the “double top”. It occurs when the price retests the same highs and is unable to break out and retreats, creating an M-shaped formation on the chart. Double tops and double bottoms are both reversal patterns, indicating a major trend shift from one direction to the opposite. While technical analysis books draw perfect patterns, in reality, the patterns are often messy, and it is sometimes challenging to detect them. M Formation or double top, fortunately, is very easy to notice because of its characteristics of two high prices on almost the same level.
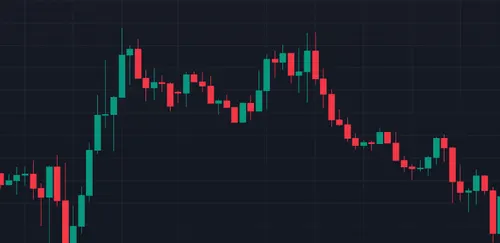
As we can see in the picture, the M Formation, or double top, is easy to spot as it has two tops with almost the same high prices on the chart. M Formation usually signals a reversal of price movement, as the momentum is weakening and the price is not able to break above the previous high. Traders often use other technical indicators like moving averages or Fibonacci levels to catch the best entries for success, but simpler methods are also possible. Let’s describe how you could use M Formation itself for trading on financial markets.
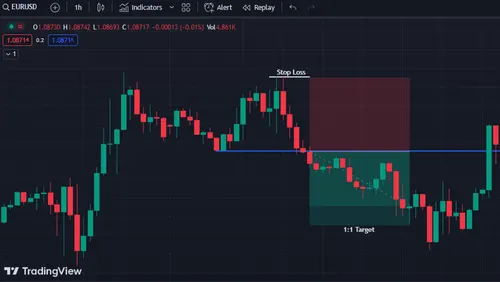
The double top can be used as a main signal for a sell trade, but it is better to wait for confirmation when the price breaks below the bottom neck of the formation. Place the stop loss slightly above the second top price and measure the length of the stop loss. Target the same distance for the profit target to increase success chances. With a 1:1 risk-to-reward ratio, meaning targeting the same distance as the stop loss usually increases the likelihood of winning, but it will require the trader to be correct more than 50% of the time to break even. It is also possible to use the double top to increase the success rate for your trading strategy by trading in the direction opposite of M Formation. One method for using M Formation as an additional filter for your trading strategy is to only pick sell signals. When double top happens, wait for the sell signals from your trading strategy, to increase your chances of winning even more.
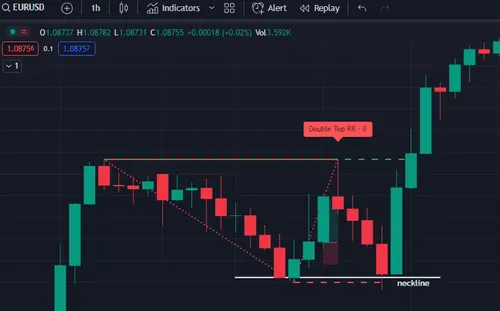
As you well know, trading is a complex matter and all indicators and patterns produce fake signals together with good signals. Detecting and protecting yourself from failed setups will filter out losing trades and increase your win rate. One of the methods is to have an additional confirmation for determining whether the M Formation is valid. The best way to use this simple filter to assist would be to wait for the candle to close below the neckline. The neckline is the bottom of the M Formation, the lowest price between the two tops. In the picture above, the price never closed below the neckline, and it continued upwards. By waiting for the candle to close below the bottom line, a losing trade was avoided, as the price went straight upwards and violated the M Formation’s highest price. It is always important to use some kind of filter for confirming the setup, otherwise, there will be many losing trades happening, decreasing the profitability of the strategy.
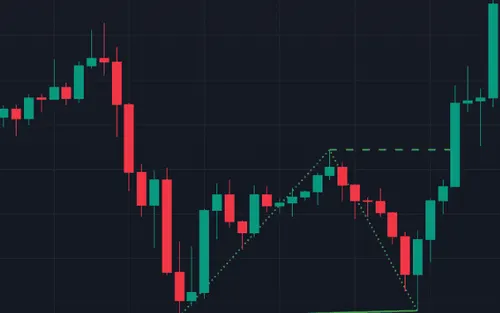
The complete opposite pattern of the M Formation is the W Formation. When using M Formation, you must also use the opposite pattern. W Formation, or a double bottom, happens when the price creates two low prices on almost the same level, is unable to break below the bottom, and reverses to bullish movement. When using it together with double tops, this will increase the number of trades taken, potentially increasing profits. For reducing the losses when using the W Formation, the same filter can be used as in the M Formation’s case.
The double top, sometimes called M Formation, is a chart pattern used by technical traders to spot potential trend reversals. An M Formation forms when the price reaches the same high twice, creating an “M” shape, fails to break out the high, and pulls back. It signals a shift in trend direction and can be confirmed by waiting for the price to break below the pattern’s neckline or bottom line before selling. Additional filters can increase the likelihood of success and filter out fake signals. Waiting for the candle to close below the pattern’s bottom can improve accuracy and reduce fake signals. The opposite formation of the double top is called the W Formation, or double bottom. It signals a potential bullish market. Using both patterns and adding confirmation methods can increase the overall number of trades and performance. In the end, M Formations and W Formations are powerful reversal patterns widely used by technical traders and can be a great addition to traders’ arsenal.
Our partner, XM, lets you access a free demo account to apply your knowledge.
No hidden costs, no tricks.
© Copyright 2022, All rights reserved