Ichimoku Cloud Explained For Forex Beginners

Ichimoku Cloud Explained For Forex Beginners

Traders on the forex market use a variety of technical indicators to catch trends and make profitable trading decisions. 

Technical indicators measure the volatility, trading volume, acceleration of trend movements, which makes it easier for traders to gather data from price movements on the market. 

One such indicator is the Ichimoku Cloud. Developed in Japan in the 1930s, Ichimoku cloud has become a popular technical indicator outside of the country as well. 

The Ichimoku Cloud provides a visual representation of several key elements on a price chart, helping traders assess various aspects of a market's price action and potential future trends.

The name is derived from the shape created by the lines, which resembles a cloud. 

The Ichimoku cloud unites a number of indicators that gives traders a more comprehensive look at the price action on the chart to make adequate decisions and construct a consistently profitable forex trading strategy

If you are a beginner trader that would like to know more about the Ichimoku Cloud indicator and how to use it in forex trading, this Investfox guide can help. 

What Is The Ichimoku Cloud Indicator?

The Ichimoku cloud is a visual representation of several key elements on a price chart. The technical indicators that make up the Ichimoku Cloud include:

  • Tenkan Sen (Conversion Line): This is the fast-moving line on the Ichimoku Cloud chart. It is calculated as the average of the highest high and the lowest low over a specified number of periods. Typically, this line represents short-term price momentum
  • Kijun Sen (Base Line): This is the slower-moving line, calculated in a similar way to the Tenkan Sen but over a longer period. It represents medium-term price momentum and can serve as a support/resistance level
  • Senkou Span A (Leading Span A): This line represents the average of the Tenkan Sen and Kijun Sen plotted forward a specified number of periods. It forms the first boundary of the cloud and is used to identify potential support or resistance levels
  • Senkou Span B (Leading Span B): This line is calculated by taking the average of the highest high and the lowest low over an even longer period and is also plotted forward. It forms the second boundary of the cloud and provides another level of support or resistance
  • Kumo (Cloud): The area between Senkou Span A and Senkou Span B is known as the Kumo or cloud. The thickness of the cloud represents the potential strength of support or resistance. A thick cloud indicates stronger support or resistance
  • Chikou Span (Lagging Span): This is the closing price of the current period plotted backward by a specified number of periods. It is used to gauge the overall trend and can help identify potential reversal points

What The Ichimoku Cloud Indicator Shows

The Ichimoku Cloud overlays important data to traders regarding the price action on the chart. Ichimoku is a lagging indicator that helps traders assess the strength of the current trend and identify potential reversal points.

Here’s what the Ichimoku cloud shows:

  • Trend Direction: One of the primary purposes of the Ichimoku Cloud is to identify the direction of the trend. It does this by visually representing whether the market is in a bullish or bearish phase
  • Support and Resistance Levels: The cloud itself, which consists of two lines (Senkou Span A and Senkou Span B) and the area between them, serves as dynamic support and resistance levels. The thickness and position of the cloud can help traders gauge the strength of these levels
  • Momentum and Momentum Reversal: The Tenkan Sen (Conversion Line) and Kijun Sen (Base Line) provide insights into short-term and medium-term price momentum. Crossovers and divergences between these lines can signal potential shifts in momentum

Using The Ichimoku Cloud In Forex Trading

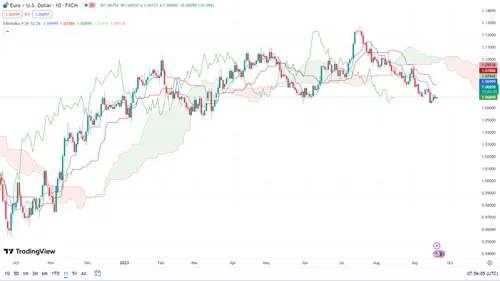
To better illustrate how the Ichimoku Cloud works in forex, let’s look at an example of the indicator plotted on the EUR/USD price chart. 

ichimoku cloud.png
  • When the conversion line and base line are both considerably above the Cloud, the trend is positive and bullish 
  • When the conversion line and base line are both considerably below the Cloud, the trend is negative and bearish 
  • When prices are above the Cloud, the trend is bullish and vice versa 
  • When the span A is rising and above the span B, the uptrend is gaining strength. When the span A is falling below the span B, the downtrend is gaining strength 
  • A buy signal is reinforced when the conversion line crosses above the base line, while both the conversion line and base line, as well as the price, are all above the Cloud 
  • A sell signal is reinforced when the conversion line crosses below the base line, while both the conversion line and base line, as well as the price, are all below the Cloud 

Pros And Cons Of Using The Ichimoku Cloud In Forex Trading

While a robust and complex indicator, the Ichimoku Cloud comes with its fair share of limitations. Considering these factors are crucial for traders to understand whether the indicator is beneficial for their trading objectives. 

Pros

  • Comprehensive Analysis: The Ichimoku Cloud provides a holistic view of a currency pair's price action. It incorporates multiple elements, including trend direction, support/resistance levels, momentum, and volatility, into a single chart. This can simplify the decision-making process for traders
  • Trend Identification: One of its primary strengths is its ability to identify trends and trend changes. Traders can use the cloud's components to determine whether the market is in a bullish or bearish phase
  • Dynamic Support and Resistance: The cloud's Senkou Span A and Senkou Span B lines create dynamic support and resistance levels that adapt to market conditions. This can be useful for setting stop-loss and take-profit levels
  • Flexible Timeframes: The Ichimoku Cloud can be applied to various timeframes, from intraday to long-term charts, making it adaptable to different trading styles and preferences
  • Clear Entry and Exit Signals: It provides clear entry and exit signals based on crossovers, cloud breakouts, and the position of the Chikou Span. This can help traders make well-defined trading decisions
  • Risk Management: Traders can use the cloud's components to set stop-loss levels and assess the potential risk associated with a trade

Cons

  • Complexity: The Ichimoku Cloud can be overwhelming for beginners due to its multiple components and the interactions between them. It requires a significant amount of learning and practice to use effectively
  • Subjectivity: Interpretation of the Ichimoku Cloud's signals can be somewhat subjective, and different traders may have varying interpretations of the same chart
  • False Signals: Like many technical indicators, the Ichimoku Cloud can generate false signals, especially in ranging or choppy markets. Traders may enter trades based on signals that do not materialize into profitable trends
  • Lagging Indicator: While the Chikou Span helps assess the current trend, it is a lagging indicator, which means it may not provide timely signals for trend changes
  • Not a Standalone Solution: The Ichimoku Cloud is most effective when used in conjunction with other forms of analysis and risk management strategies. Relying solely on the Ichimoku Cloud can lead to suboptimal trading decisions
  • Market Conditions: It may perform differently in different market conditions. For example, it may work well in trending markets but less effectively in range-bound markets

Key Takeaways From Ichimoku Cloud Explained For Forex Beginners

  • The Ichimoku Cloud is a complex technical indicator used in trading that overlays important price data on the chart
  • The Ichimoku is a multilayered indicator that consists of a conversion line, a base line, three spans, and the Cloud
  • The indicator gives a detailed view of price action on the chart and some traders may find it somewhat overcomplicated 
  • Bullish and bearish trends can be confirmed when the conversion line crosses above or below the base line 

FAQs On Ichimoku Cloud

What are the components of the Ichimoku Cloud?

The Ichimoku Cloud consists of a conversion line, a base line, the Cloud, span A, span B, and the lagging span. 

The crossings of the conversion and base lines with respect to the price line, determine whether the trend is bullish or bearish.

How does the Ichimoku Cloud generate signals?

The Ichimoku Cloud generates bullish and bearish trend signals when the conversion line crosses above or below the base line. When the price also crosses above or below the base line, a buy/sell signal is reinforced. 

Is Ichimoku Cloud a reliable indicator?

While the Ichimoku Cloud offers a comprehensive look at the price action of an asset, it is a somewhat visually complicated indicator that some traders may find tedious. 

The indicator may also sometimes generate false signals, which is something traders need to consider when using it.