Our partner, XM, lets you access a free demo account to apply your knowledge.
No hidden costs, no tricks.


Forex indicators are technical tools that track price data and provide various analyses of the price. They are super useful for technical traders, as they can show hidden tendencies that are impossible to see on naked charts. While some indicators never change already painted results, some of them repaint the charts. Repainting means the indicator changes its previous results and can lead to losses due to false signals. Let’s dive deep and understand which are the best indicators that do not repaint. As a bonus, we will provide one trading strategy using non-repainting indicators.
When past signals and values of the technical indicator change after incoming new data, we call it a repainting phenomenon in Forex markets. Repainting can be very dangerous as it introduces inefficiencies and inconsistencies in trading.
We, as traders, always need to analyze past performance or backrest a trading strategy and often use various indicators to get trading signals. How can we analyze previous signals and the performance of the trading strategy if these signals always change? It is super important to detect if the indicator is repainting, especially when you are trying to use a custom indicator downloaded from unknown sources. One way of detecting a repainting indicator is to watch if the past results change on the chart. You might be asking right now: if repainting is this bad, then why are there still indicators in FX that repaint?
The main reasons why indicators may be repainted can be several: one is the inefficient programming of the indicator, and the other is to deliberately use repainting to show your indicator as infallible. Some indicators, that repaint, are popular among traders. At any rate, it is always advisable to avoid repainting indicators to maintain consistency in trading. Without analyzing past trades or testing the strategy, we traders will be more like gamblers rather than professional traders. Traders always search for an edge in the markets to make consistent profits, and gambling is not something we want.
Before we proceed to the list of the non-repaint indicators, let’s list some repainting ones and explain why sometimes they can be useful, although on very rare occasions. Probably the most well-known repainting indicator in the FX scene is a ZigZag indicator.

Zigzag is mainly used to help traders identify significant price reversals by filtering out minor price fluctuations. Whenever the newer significant price movement is more than the previous one, the indicator repaints, which makes it a bit dangerous to use for trading. However, it is useful to make sense of extreme price points on the chart. Zigzag makes it much easier to see how price is behaving and can make analysis much quicker and more obvious to us. While experienced traders will see these points anyway, the indicator can be a tremendous help for beginners.

Another very popular and well-known indicator is fractals. Fractals highlight potential reversal points in the market. But they also repaint, which can easily lead to false signals. Fractal points on the chart adjust with new price data, particularly the last fractal point can change depending on the new price data, making it risky for trading. The indicator is very useful to see swing highs and lows more clearly and can be a great indicator in conjunction with other indicators, but never as a standalone solution.
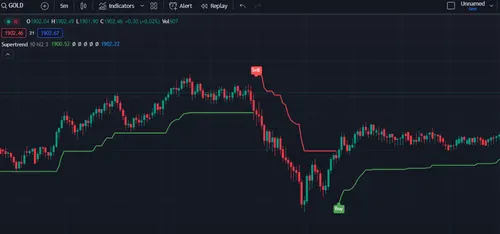
SuperTrend indicator is commonly used for identifying trends and potential entry or exit points, and for repainting occasionally. It is calculated based on the average true range (ATR) and a multiplier value. SuperTrend plots the line above or below the current price chart showing the main direction of the market. The indicator can greatly aid traders as it indicates the current trend direction and potential support or resistance levels. As with every previous repainting indicator, it is always a terrible idea to use this indicator stand-alone for identifying the price trends.
Some indicators like Moving Averages and Bollinger Bands never repaint and can be used freely for the exact past performance of a trading strategy or used as a signal in conjunction with other tools. Let’s list some of the most popular indicators which never repaint.
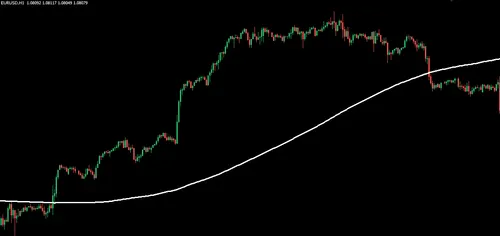
The Moving Average is the most widely used technical indicator in the FX trading world. It is robust, simple to use, and can provide an idea of general trend direction. Its simplicity means even beginners can use it in their analysis and trading activities. It is a mathematical formula that calculates the average price for user-selected past periods and provides a line that follows the price chart. The most popular moving average type is the 200-day Exponential Moving Average (EMA) which is widely used by experienced traders to detect the trend. If the price is above the 200-day EMA, then traders will only look for buy signals and vice versa. As in the case of other indicators, MAs are a great way to filter signals but never a standalone solution.

This complex yet useful technical analysis tool measures volatility and potential price reversals in FX and all other financial markets. Bollinger Bands are widely used by traders of various types. It consists of three components:
Central Moving Average (SMA or EMA) – which is a moving average representing the average price over a specific period. This central line is useful for identifying the general trend direction.
Upper Band and Lower Band – are drawn above and below the central line and are calculated based on a standard deviation of price from the central line. Based on the market volatility, the distance between two bands widens or narrows. Bollinger Band is popular for a reason, it is a dynamic indicator that adjusts to market conditions as it expands during high volatility and contracts when markets are less volatile.
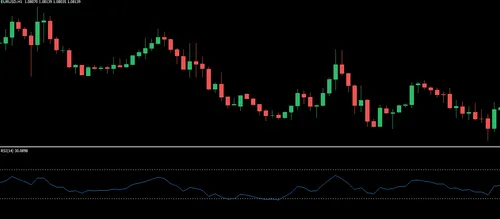
RSI is yet another super popular indicator used to gauge the speed and magnitude of price movements. It is usually plotted in a separate window below the price chart and scales between 0 and 100. It mainly assists trailers in identifying oversold and overbought conditions in the market. RSI above 70 indicates that the asset’s price is rising rapidly or is strongly overbought, and below 30 suggests the price is falling and is oversold. RSI like other indicators is a great indicator to confirm the trading signal but is risky to use solely for analysis. One popular way traders use RSI is to spot divergences, meaning when the price is making higher highs, but RSI is showing lower lows. In this case, traders might need to wait for a price reversal.
Non-repaint indicators are very robust solutions when analyzing financial markets. It is easy to go back and recheck the non-painting indicators, as their previous values never change, providing stability in market analysis. While repainting indicators are not stable and can produce many false signals that can not be tracked, non-repainting ones are always easy to check. This is critical to analyze the performance of the trading strategy. Repainting indicators can hide false signals and give a false feeling of having a winning strategy. This can naturally lead to unexpected losses and frustration. If you decide to use any repainting indicators, make sure you use them to help you see the main tendencies on the charts and never for trading signals.
Now let’s briefly list the main pros and cons of both repainting and non-repainting indicators to have a clearer understanding.
We, traders, never use any one indicator alone to make predictions or analyze markets, as there is no single indicator that is infallible. When markets are in a strong trend, no indicators will produce correct signals. Another downside of indicators is that they are lagging, meaning they only show results after the price has already moved and do not predict the price. Divergences can help reduce this lagging phenomenon by providing signals before market reversals but require some time to master. As a result, most strategies use two or more indicators to trade profitably, and we are going to list one of them below.

This is one of the most well-known and simple strategies using two moving averages fast and slow. Short-term and long-term moving average crossover can be used as a trading signal. When fast or short-term MA crosses, the slow or long-term upwards buy signal is emitted, and vice versa for sell signals. But using only this signal will ensure traders lose money. So we need to add some filters to make it more accurate. Let’s add 200 EMA and RSI as additional filters to the MA crossover strategy. This way, when the price is below the 200 EMA we only look for bearish or sell signals and when the price is above the 200 EMA we focus on buy signals. This way we ensure that we are always trading in the direction of the main trend to filter out all false signals. Using RSI, we sell when RSI is overbought and starts to decline, and fast MA crosses the slow MA below. We encourage our readers to use this strategy for only educational purposes and add and test various filters to make it more accurate.
Our partner, XM, lets you access a free demo account to apply your knowledge.
No hidden costs, no tricks.
© Copyright 2022, All rights reserved