

Our partner, XM, lets you access a free demo account to apply your knowledge.
No hidden costs, no tricks.

We will discuss candlestick patterns and specifically confirmation candles in this article. Candlestick patterns are widely used by traders to anticipate potential movements in the markets and capitalize on them. A confirmation candle can make the difference between winners and losses. Every trader must understand not only candlestick patterns but confirmation candles as well. By utilizing the power of candlestick patterns and confirmation candles, traders can increase their potential win rate.
Candles can be found on a type of chart called a candlestick chart that offers a unique visual representation of the price for a certain period. It is one of the most popular chart types as all the important information is displayed in an easy-to-understand manner, which is very important in Forex and other financial trading markets. Before we proceed to candlestick patterns and confirmation candles, we need to understand what the candle represents and how to read bullish and bearish candles.
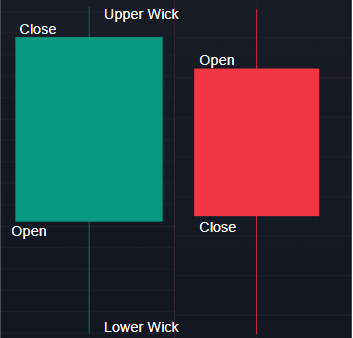
As we can see, candles show everything a trader needs to make sense of price movements. The green candles or bullish candles form when the price for that duration of the candle is moving upwards. It opens below and closes above. The lines below and above each candle are called shadows or wicks. Wicks form when the price falls below the opening price, can not maintain momentum, and then goes above again. Wick shows the lowest and highest prices and is useful for determining how powerful the price impulse was. The longer the wick, the more powerful the price movement was before reversing. For bearish, or red candles, the opening price is above the closing price, indicating that the price was falling and closing below the opening price. By using candles, traders can understand what the lowest, highest, opening, and closing prices of any previous candle were.
A candlestick chart is one of the most popular chart types for representing the price data visually. Representing the price with good visual methods can greatly aid traders in simplifying pattern detection during trading. Candlestick patterns are especially handy for finding trading opportunities, and there are a multitude of popular methods. Using complex technical analysis for identifying trends is one thing, but seeing and recognizing visual figures and formations is much more important for traders. After understanding patterns, it is much easier to understand how confirmation candles are used by experienced traders and why they are so popular. Some of the most popular candlestick patterns in trading include:
One important detail with candlestick patterns is that there are usually two opposite formations with different names, one bullish and the other bearish. Doji itself suggests indecision as sellers and buyers can not decide which direction to go and indicates a possible slowing down in momentum.

Doji is a candlestick characterized by a small body, where the open and close prices are nearly the same, resulting in a thin horizontal line. It typically signals the reversal of already established price trends and is a very popular pattern. But, using solely a doji for making trading decisions is a big mistake, as other confirmation factors are needed. Using a confirmation candle, for example, a doji following a bearish candle, can increase the likelihood of it being a successful doji signal. A bullish confirmation candle for doji would be a green candle after a doji forms at the bottom of the price chart. The opposite is true for bearish doji confirmations. In the picture above, the doji is confirmed by the following bearish red candle, increasing the chances of a successful trade.
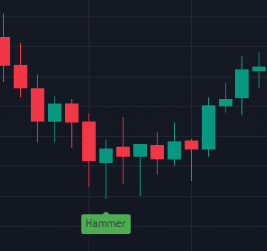
Hammer and shooting star are the two opposite candlestick patterns in technical analysis. A hammer is a bullish reversal pattern that usually forms at the end of a downtrend, while a shooting star is a bearish pattern forming at the end of an uptrend. The characteristics are also reversed for the two opposite patterns as for the hammer has a small body near the top of the price range, and a long lower wick at least twice the length of the body. For shooting start a small body near the bottom of the price range, with a long upper wick at least twice the length of the body is necessary.
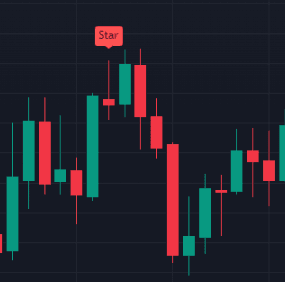
Another popular candlestick pattern that can be used as a confirmation candle is called a shooting start. It is recognized as a candle with a small body located at the bottom of the price range, with a long upper wick extending above the body.
Engulfing occurs when the current candle’s body completely consumes the body of the previous candle. Engulfing candles are very useful and can be used as confirmation candles for various trading methods, including other candlestick patterns.
Bullish engulfing candles happen when the body of the engulfing candle is larger than the body of the previous red or bearish candle.
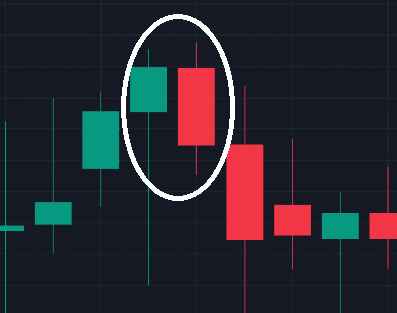
Bearish engulfing happens when the red candle has a larger body size than a previous bullish or green candle.
So, what is the exact process for identifying and using confirmation candles in trading? Here is the list of each step with examples to simplify the learning process.
Finding the trend is most important to avoid false signals. When the trend is strong, it is always desirable to trade in the trend direction and use candlestick patterns as a confirmation candle to increase the success rate. If the trend is waning, then use several patterns or confirming candles to enter the trade.
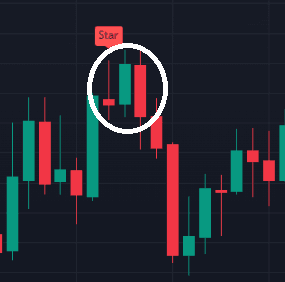
In our previous example of trend analysis, the critical zone was identified by spotting the shooting star. Knowing that potential reversal could be imminent, we wait until some kind of confirmation signal is detected to increase the chances of success.
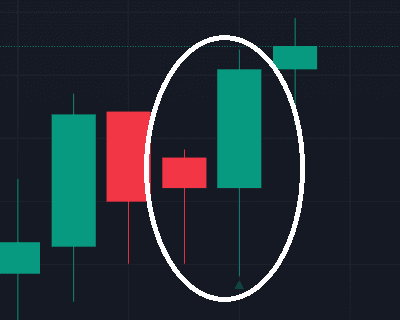
In the picture above, we can see that a shooting star was forming, but because the trend still had power in it, the next candle was green. If a trader were to open a trade solely using shooting star as confirmation, they would have lost money. Using an engulfing candle as confirmation would be a better signal to enter, as it confirmed the shooting star by completely engulfing the previous bullish candle. By following these steps, it was easy to identify the trend using a shooting star, waiting for the second confirmation candle to further increase the chances of detecting the reversal.
One common mistake when using any kind of candlestick or other types of trading methods is solely relying on one pattern. Using only one indicator or pattern without using other filters and confirmations is a guaranteed way of losing money. The markets are dynamic and complex adaptive structures that require several filters to ensure the trading signals are as high quality as possible. Only relying on one pattern will overlook other important aspects such as trends and important support and resistance zones. Using trend lines and significant zones as an additional filter will increase the likelihood of identifying winning trades. In our case, we successfully used a confirmation candle to confirm the shooting star pattern. Using an engulfing candle as a confirmation candle increased our chances of correctly predicting the next move.
Our partner, XM, lets you access a free demo account to apply your knowledge.
No hidden costs, no tricks.
© Copyright 2022, All rights reserved