

Our partner, XM, lets you access a free demo account to apply your knowledge.
No hidden costs, no tricks.
Many traders will argue that technical analysis is the backbone of successful trading. Various charts and technical indicators have emerged over the years, which have helped traders better understand the relationship between price, volume, and volatility.
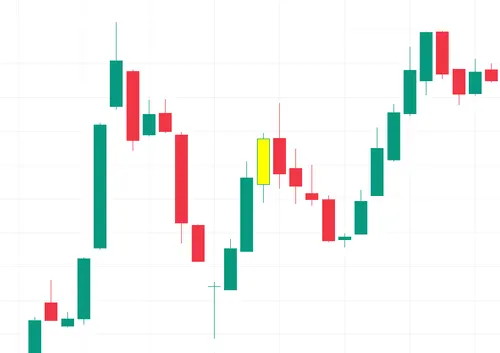
The candlestick chart is one of the most popular chart types used when trading financial instruments. A candlestick represents a specific time period on the chart, such as a minute, hour, day, etc. The pattern consists of the “body” and the “wick” and shows the opening, closing, highest and lowest price points during the period.
If the opening price is lower than the closing price, the real body is typically colored green or white to indicate a bullish trend, while a red body shows a bearish trend.
Chart patterns are essential parts of any trading strategy, as they represent key points on the chart that show the reversal or continuation of a prevalent trend.
There are dozens of patterns traders can identify on candlestick charts and each of them can be used in conjunction with technical indicators to generate buy and sell signals and make profitable trades.
If you would like to know more about the essential candlestick patterns to look for - this investfox guide is for you.
Candlestick patterns are formations that occur on candlestick charts and provide traders with signals to better anticipate future price movements and make trades accordingly.
There are several different candlestick patterns, including singular and multiple patterns, that consist of one or more candlesticks on the chart.
A singular candlestick pattern is a single candlestick and can provide insights into the market sentiment. For instance, a hammer pattern is formed by a small real body at the top of a long lower shadow, which can indicate a potential bullish reversal.
Multiple candlestick patterns represent an arrangement of multiple candles and can provide even greater insight. For instance, a bullish engulfing pattern is formed by a small bearish candlestick followed by a large bullish candlestick, which can indicate a potential bullish reversal
Bullish candlestick patterns signify a trend reversal and significant bullish momentum, which is noteworthy for traders and represents buying opportunities before the price starts climbing. There are a wide variety of bullish candlestick patterns traders can observe and use in their strategies and each of them are suitable for specific market conditions.
The hammer candlestick pattern is a bullish reversal pattern that forms at the bottom of a downtrend, indicating that the trend may be about to reverse.
The hammer candlestick pattern consists of a candlestick with a small body and a long lower shadow. The long lower shadow represents the price dropping significantly during the trading session, but the buying pressure was able to push the price back closer to the opening price - forming a hammer-like shape.
Traders look for hammer candlesticks as a buy signal as it indicates that the bullish trend is gaining strength and prevailing in the market.

An inverted hammer is a candlestick pattern that appears at the top of an uptrend and signals a potential reversal. The pattern is also frequently referred to as the “shooting star” pattern.
The inverted hammer candlestick has a small body at the top of the candle and a long shadow below, indicating that the price has risen during the trading session, but bearish pressure has pushed the price back.
The long lower shadow suggests that there was significant buying activity during the session, but ultimately it was unable to maintain the bullish momentum.
Traders look to the inverted hammer pattern as an indicator to sell, as it suggests that bullish momentum has slowed and bears are about to take over.

The morning star is a candlestick pattern that appears at the bottom of a downtrend and signals a potential reversal in the price trend. It is composed of three candlesticks:
The morning star pattern suggests that the bears have lost control of the market and the bulls are starting to gain control, indicating a potential trend reversal.

The bullish engulfing candlestick pattern is a bullish reversal chart pattern that appears at the bottom of a downtrend and is formed by two candlesticks:
The bullish engulfing pattern suggests that the bulls have gained control of the market and are pushing the price up, indicating a potential trend reversal. Traders can use this as a signal to enter long positions.
Bullish engulfing patterns alone may not be solid enough evidence to indicate a trend reversal and should be used in conjunction with other technical indicators. Other factors, such as trading volume and overall market conditions, should be closely monitored.

The three white soldiers candlestick pattern is a bullish reversal pattern that appears at the bottom of a downtrend. The pattern is formed by three consecutive long bullish candlesticks, each with a higher close than the previous candlestick, and with little or no wicks or shadows.
The three white soldiers pattern suggests a strong shift in market sentiment from bearish to bullish - indicating a potential reversal. This can be seen as a signal to enter long positions.
Similarly to engulfing patterns, three white soldiers may not be enough to generate reliable buy signals on their own.
The on-neck candlestick pattern is a bearish continuation pattern in technical analysis that appears during a downtrend. It is formed by two candlesticks:
The on-neck pattern suggests that the bears are still in control and the price is likely to continue on its downward trend. Traders may use this pattern as a signal to enter short positions. However, on-neck patterns do not provide enough data for traders to base their trade decisions on and should be used in conjunction with other technical indicators.
The bullish harami is a bullish reversal candlestick pattern that occurs during a market downturn and is formed by two candlesticks:
The bullish harami pattern suggests that the bears are losing control and bulls are starting to gain momentum - indicating a potential trend reversal. Traders may see a bullish harami as a sign to enter long positions, anticipating further price increases to come.
However, the bullish harami may not always be reliable and can generate plenty of false buy signals and it is important for traders to look at the broader picture to see whether the bullish harami is part of a larger trend.
The tweezer bottom candlestick pattern is a bullish reversal pattern that appears at the bottom of a downtrend and is formed by two or more candlesticks:
The tweezer bottom pattern suggests that the bears have failed to push prices lower and that the bulls are starting to gain control, indicating a potential trend reversal. Traders can use a tweezer bottom as a signal to enter long positions, however, tweezer bottoms may generate false buy signals on occasion and traders need to be aware of this possibility.
The piercing candlestick pattern is a bullish reversal pattern that appears at the bottom of a downtrend and is formed by two candlesticks:
The piercing pattern suggests that the bulls have gained momentum and are starting to gain control, indicating a potential trend reversal. Traders may use this pattern as a signal to enter long positions in anticipation of further price increases to come.
Confirming the piercing pattern may require the use of other technical indicators to avoid false buy signals.
The white marubozu is a candlestick pattern that appears during an uptrend. The pattern is formed by a single long bullish candlestick with little or no upper or lower shadow or wick.
The white marubozu pattern suggests that the bulls are in control of the market and that the bullish momentum is likely to continue. Traders may use the pattern as a signal to open or hold long positions in anticipation of further price increases.
However, similar to many bullish candlestick patterns, the white marubozu should not be viewed as a conclusive one in confirming a bullish trend.
Bearish candlestick patterns occur on a price chart to indicate a bearish trend continuation or reversal. Bearish patterns are viewed by traders as signals to open or hold short positions in anticipation of price declines.
The bearish engulfing pattern is a bearish reversal pattern in technical analysis that appears during an uptrend and is formed by two candlesticks:
The bearish engulfing pattern suggests that the bears have gained control and that the bullish momentum is likely to reverse into a bearish trend.
Traders may use the bearish engulfing pattern as a signal to enter short positions.
The hanging man candlestick pattern is a bearish reversal pattern that appears at the top of an uptrend. It is formed by a single candlestick with a small body, a longer lower shadow, and little to no upper shadow or wick.
The hanging man pattern suggests that the bulls have lost their momentum and that the bears are starting to gain control, indicating a potential trend reversal.
While traders may see this as a signal to enter short positions, it is important to understand that the hanging man pattern alone is not enough to indicate a full bearish trend reversal.
The block marubozu is another bearish candlestick pattern that appears as a single long black candlestick with little or no upper or lower shadow or wick.
An opposite of the white marubozu, a black marubozu suggests that the bears are in control of the market, and that the bearish momentum is likely to continue - making it a bearish continuation pattern.
However, before traders enter short positions, they should take the pattern with a pinch of salt, as it represents only a single candlestick and can often mislead traders and generate false sell signals.
The dark cloud cover candlestick pattern is a bearish reversal pattern that appears at the top of an uptrend and is formed by two candlesticks:
The dark cloud cover pattern indicates that the bulls have lost their momentum and a bearish reversal may be imminent. Traders may use the dark cloud cover pattern as a signal to open short positions and the pattern provides a more solid footing, as it consists of two candlesticks.
The tweezer top candlestick pattern is a bearish reversal pattern that appears at the top of an uptrend. The pattern is formed by two or more candlesticks with comparable highs, forming a horizontal resistance level.
The tweezer top pattern suggests that the bullish trend is losing momentum and a bearish reversal is likely to occur. The tweezer top is the opposite of the tweezer bottom and provides one of the more reliable indicators of a trend reversal, due to the number of candlesticks involved in the pattern formation.
The shooting star candlestick pattern is a bearish reversal pattern that appears at the top of an uptrend. The pattern is formed by a single candlestick with a small body, a long upper shadow or wick, and little to no lower shadow.
The shooting star patterns show that the bulls have lost their momentum and the bears are gaining ground - indicating a potential trend reversal.
Typically, the upper shadow of the shooting star pattern is at least twice the size of the real body.
Since the shooting star consists of only one candlestick, it is not viewed as a determinant of a trend reversal on its own.
The three black crows candlestick pattern is a bearish reversal pattern that appears at the top of an uptrend. The pattern is formed by three long black (or red) candlesticks with short or no shadows, each opening below the previous day’s closing price and closing at a new low.
The three black crows pattern suggests that the bears have taken control of the market and that a trend reversal may be imminent.
Traders can use the three black crows pattern as a sell signal, as it is one of the more reliable signals of a bearish reversal.
The evening star candlestick pattern is a bearish reversal pattern that appears at the top of an uptrend and is formed by three candlesticks:
The evening star pattern suggests that the bulls have lost their momentum and that the bears are starting to gain control, indicating a potential trend reversal.
Traders can enter a long position if a bearish candle is formed the next day and place a stop-loss at the high of the second candle.
The bearish harami is a bearish reversal pattern that appears at the top of an uptrend and is formed by two candlesticks:
The bearish harami pattern suggests that the bulls have lost their momentum and that the bears are starting to gain control, indicating a potential trend reversal.
While traders may view this as a sign to enter a short position, the bearish harami alone may not be enough to accurately identify a bearish reversal.
The three inside down candlestick pattern is a bearish reversal pattern that appears at the top of an uptrend and is formed by three candlesticks:
The three inside down pattern suggests that the bulls have lost their momentum and bears are entering the market. The pattern is one of the more reliable technical indicators of a trend reversal.
Continuation candlestick patterns are patterns that indicate a high probability that the current prevailing trend will continue after a brief period of consolidation.
The doji candlestick pattern consists of a single candlestick and indicates indecision on the market and a potential reversal. It is formed when the opening and closing prices are almost identical, resulting in a candlestick with a very small body.
There are several types of doji patterns, including:
The upside tasking gap pattern is a bullish continuation pattern that occurs during an uptrend and consists of three candlesticks:
A key feature of the upside tasuki gap pattern is that the third candlestick partially closes the gap created by the second candlestick, indicating that the bears tried to take control but failed. The pattern suggests that the bulls have retained control and the trend is likely to continue.
The downside task gap is a bearish continuation pattern that occurs during a downtrend and consists of three candlesticks:
A key feature of the downside task gap is that the third candlestick partially loses the gap created by the second candlestick, indicating that the bulls tried to take control but failed. The pattern suggests that the bears have retained control and the downside trend is likely to continue.
The spinning top is a continuation pattern that consists of a candlestick with a small real body with long upper and lower shadows. The spinning top pattern indicates some indecision between buyers and sellers, with neither side managing to tip the scales in their favor.
The pattern suggests that there is no clear winner in the market, and there is a balance of power between buyers and sellers. This can happen during a period of consolidation in the market.
The length of the shadows are noteworthy signs to consider.
If the shadows are long, it indicates a lot of volatility and a greater degree of uncertainty in the market.
Spinning tops can inform traders about a possible breakdown of the prevailing trend.
The rising three methods pattern is a bullish continuation pattern that occurs within a prevailing uptrend. It is formed by a series of candlesticks that indicate a temporary consolidation before the uptrend resumes. The pattern consists of the following components:
The rising three methods pattern suggests that the bulls remain in control despite the brief period of consolidation. It indicates that the market is gathering momentum to resume the upward movement.
The falling three methods pattern is a bearish continuation pattern that occurs within a prevailing downtrend. The pattern is formed by a series of candlesticks that indicate a temporary consolidation before the downtrend resumes. It consists of the following components:
The falling three methods pattern suggests that the bears remain in control despite the brief period of consolidation and that the market is gathering momentum to resume the downward movement.
The high wave candlestick pattern, also known as a long-legged doji or a long-legged spinning top, is a candlestick pattern that indicates indecision among buyers and sellers.
The pattern is characterized by a relatively small body with long upper and lower shadows or wicks. The opening and closing prices are typically quite close to each other.
When the high wave pattern occurs, it suggests that neither the buyers nor sellers have managed to gain an advantage.
The high wave pattern often occurs during periods of consolidation, market indecision, or at potential reversal points. Traders may interpret the high wave pattern as a signal to exercise caution and look for additional confirmation before making trading decisions.
The rising window pattern, also known as a rising gap, is a bullish continuation pattern that occurs when there is an up gap in prices, indicating strong buying pressure and a potential continuation of an uptrend. The pattern is formed by two candlesticks:
The rising window pattern suggests that there is a strong influx of buyers and a continuation of the upward movement in prices. The gap up indicates that buyers are willing to pay higher prices to enter or hold positions in the market.
The opposite of the rising window, the falling window pattern, also known as a falling gap, is a bearish continuation pattern that occurs when there is a down gap in prices, indicating a strong selling pressure and a potential continuation of a downtrend. The pattern is formed by two candlesticks:
The falling window pattern suggests that there is a strong influx of sellers and a continuation of the downward movement in prices. The gap down indicates that sellers are willing to accept lower prices to enter or hold positions in the market.
The Mat-Hold pattern is a bullish continuation pattern that happens during an uptrend. It is a five-candlestick pattern that represents a brief consolidation period before the uptrend resumes:
The Mat-Hold pattern suggests that the bullish momentum remains intact despite the temporary consolidation. It indicates that the bulls are still in control and the uptrend is likely to resume.
Our partner, XM, lets you access a free demo account to apply your knowledge.
No hidden costs, no tricks.
Candlestick patterns are technical patterns on price charts that show the continuation or reversal of trends on the chart.
Candlestick patterns are legitimate technical indicators traders use to determine the future direction of price charts. However, candlestick patterns are not always reliable and traders are advised to use other technical indicators in conjunction with candlestick patterns when making decisions.
Candlestick patterns are composed of individual candlesticks, which consist of open and closing prices, as well as high and low points, or the body and wicks of the candlestick.
© Copyright 2022, All rights reserved