

Our partner, XM, lets you access a free demo account to apply your knowledge.
No hidden costs, no tricks.

The world of financial markets has been growing a lot in recent years, and one of the biggest contributors to this growth is the cryptocurrency market. The crypto market has grown exponentially, but it is still far from the size of traditional markets such as stocks and Forex. This growth of the crypto market is thanks to blockchain developments as well as many new people joining this space with the hopes of making good profits.
But most of these newcomers to the crypto market are complete beginners when it comes to financial trading and investing, as this is their first venture into financial markets. What this means is that the market is full of beginner traders who have very little experience and most of these newcomers usually suffer big losses. The reason for these losses, in most cases, is that they are not utilizing the tools that are necessary for success. Indicators are one of these tools and today we will be taking a look at one of these indicators to see how traders can implement it in their trading. So what is the RSI indicator and how can we trade cryptocurrencies using it?
Relative Strength Index, RSI for short, is a momentum-based indicator that is commonly used for range trading. RSI looks at the speed and extent of cryptocurrency price changes and based on it, calculates if crypto is overbought or oversold. When using this indicator, it looks at cryptocurrency prices and compares two important factors of the crypto. It looks at the cryptocurrency's strength when prices went up and strength when prices went down. With a comparison of these two factors, RSI can predict how crypto is expected to perform based on how it performed on previous occasions.
When applied to the charts, the RSI indicator sits below the chart as an oscillator. There the RSI moves as a line between the ranges of 0 to 100. If we see RSI go over 70, it means that crypto is most likely overbought and prices might start falling, while if RSI falls below 30, it means the asset is oversold and the price might start to rise once again. This is not guaranteed and there are cases when crypto is in the overbought range and the uptrend is still continuous for extended periods of time, and the same is true for the oversold range. Because of this, it is best to use the RSI indicator in combination with other indicators as it will make analysis much more effective and accurate.
When it comes to trading crypto with the RSI indicators there are many ways one can do it. One of the most common ways is to trade the range. Since the RSI indicator has two values of 70 and 30 to identify an overbought and oversold state, traders can simply purchase cryptocurrencies when RSI reaches 30 and then sell when it goes to 70. After this, traders can open short positions and close them when RSI reaches 30 again. This is a simple and straightforward method of trading with RSI, but it also has its own risks. Since cryptocurrencies are speculative assets and they tend to be highly volatile, even after reaching 70, tokens can continue gaining value for extended periods of time, or they can continue losing value long after reaching 30.
Another way of using the RSI indicator is trend trading. Since cryptocurrencies are highly volatile, trend directions change quite frequently and we can use the RSI indicator to identify these trend reversals. But when doing so, it is important to understand that not every cryptocurrency will have the same trend reversal mark, meaning that if 70 and 30 works for one cryptocurrency, it might not work for another and as traders it is our goal to identify these trend reversal points and only after this use RSI as a trend reversal indicator.
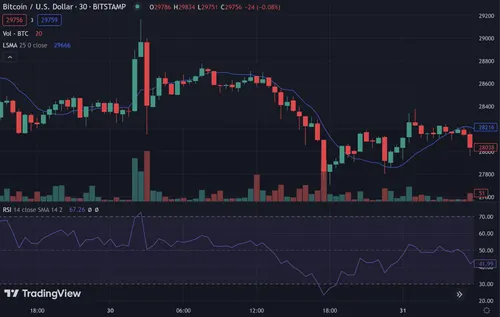
To better understand how we can trade cryptocurrencies with the RSI indicator let’s look at an example. In this case, we are trading with the BTC/USD trading pair using the RSI indicator. Looking at the chart we can see that the first instance RSI goes over the 70 mark there is a big spike in value, but then it starts to lose value and prices drop. During this time, we could have opened a short position since RSI indicated that BTC was overbought. Then we enter a volatile state which grows into a downtrend, but once the RSI goes below the 30 mark, the price starts to recover and starts to go up again. Once the RSI went below the 30 mark, we could have opened a long position, as BTC was oversold and prices were expected to rise.
Looking at this, it seems a very simple and straightforward way to trade cryptocurrencies, but if we take a better look, we can see that the RSI indicator only shows the potential movement of the following 1-2 candles and simply it going over the oversold or overbought mark does not mean that the trend reversal will be strong enough to make good profits. Because of this, we need to be cautious when trading with the RSI indicators and always have other supporting tools that will help us better understand the market conditions.
Our partner, XM, lets you access a free demo account to apply your knowledge.
No hidden costs, no tricks.
RSI is one of the most popular indicators for crypto trading. The only indicator that is used more frequently than RSI is the Moving Average indicator. Since cryptocurrencies are volatile assets, their prices change pretty frequently, and because of this, it is common for them to be overbought or oversold. This is exactly what the RSI indicator is designed to catch and because of this aspect of cryptocurrencies, the RSI indicator can generate good profits and provide multiple good readings throughout the day.
It is generally considered a good idea to buy cryptocurrencies when RSI hits 30, but when doing so you should have a few security measures in place. There is always a possibility that once hitting 30, the price of crypto won’t reverse and it might continue to go down for some time. If you are simply buying and selling on the spot market there should be no problem buying when RSI hits 30, but if you are doing futures trades using leverage, you should have stop-loss orders in place.
© Copyright 2022, All rights reserved