

Our partner, XM, lets you access a free demo account to apply your knowledge.
No hidden costs, no tricks.

Cryptocurrency trading is becoming more and more common and while it is still far from the Forex or the stocks arena, this is a market that has proven it is here to stay. There are many different factors that differentiate crypto markets from other traditional markets, and one of the most significant differences is the experience of people trading on them.
Crypto has attracted many new people to the world of trading and investing, meaning that a large number of people who trade and invest in cryptocurrencies are people who have not dealt with any other financial markets before joining the crypto zone. This inexperience along with the high volatility of cryptocurrencies is a risky combination and because of this, many newcomers suffer losses when they are first starting out.
There are many reasons for this, but one of the most common reasons is that these newcomers rarely use trading tools and mostly trade blindly by buying crypto when they think it's low and hoping it will go up in value to sell it off for a profit. In most cases, these investments and trades are not backed by anything other than these traders' beliefs. But using trading tools is crucial for success and today we will be taking a look at one of these tools to see how traders can use it to their advantage when getting into crypto trading.
Moving Average Convergence/Divergence, or MACD for short, is a trend-following indicator that looks at two different Exponential Moving Averages (EMAs) and makes connections between them and the price of the cryptocurrency. MACD is calculated by subtracting the 26-period EMA from the 12-period EMA and we are given a MACD line. But in most cases, we don’t need to make this calculation ourselves as the indicator does it and simply displays the MACD line to us.
When using the MACD we will be given either a positive or negative number, based on whether the 26-period EMA is greater than the 12-period EMA or not. Once MACD is calculated it will be displayed on a histogram, and not on top of the chart. A histogram is a special space below the chart where certain values are displayed, such as trading volume. Once we have our MACD displayed it's time to implement it in our crypto trading.
As we mentioned above, the MACD indicator is displayed as a line and is placed below the chart on a histogram. Along with this indicator, we need to introduce a signal line in the form of an additional EMA. There is no fixed value for this signal line, but it is universally acknowledged that a 9-day EMA is the best signal line. After we have these two set up, we need to watch their movements. If we see that the MACD line has gone over the signal line, it usually means that prices are going to go up, and it is best to enter long positions. But if we see that the MACD line falls below the signal line, then it signals a bearish trend, and prices are expected to fall. We also need to mention that MACD is a lagging indicator, meaning that the data it provides can be a little late and traders need to account for that when using this indicator. It is also advised to never trade with just one indicator, especially if it’s a lagging indicator. Traders should implement multiple tools into their trading activities and never be dependent on just one indicator providing all necessary information.
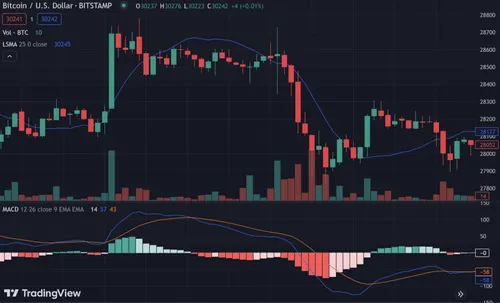
To better understand how the MACD indicator works and how to use it when trading with cryptocurrencies, let’s take a look at an example. In this case, we are trading with the BTC/USD trading pair, using the MACD indicators, which is placed below the chart on the histogram.
Looking at the chart, we can see that when the MACD line (blue line) first crossed the signal line (orange line) we saw a huge spike in value and prices increased drastically. But then BTC went into a volatile state and once the MACD crossed below the signal line, prices started to drop sharply, this drop was intensified when MACD crossed below the zero line, meaning that it went into negative numbers. But then we can see that the MACD line started to rise once again and so did prices, up until it fell below the signal line once again and prices started to drop.
Our partner, XM, lets you access a free demo account to apply your knowledge.
No hidden costs, no tricks.
When trading with a MACD indicator, we need to use a combination of the MACD indicator and signal line, which in most cases should be a 9-period EMA. Once we have an indicator and signal line displayed on our chart, we need to start looking for crossovers between the MACD line and the signal line. If the MACD indicator is above the signal line, it signals that we are in a bullish market and prices are expected to go up, while if the MACD line falls below the signal line, it signals that there is a likelihood of prices falling. Based on these signals we can make educated guesses and open profitable trades. It is also important to never believe just one indicator blindly and always make sure to implement multiple tools when trading.
The MACD indicator is a lagging indicator meaning that it looks at historical information and displays signals based on that. This makes them pretty accurate indicators to use, but since they are lagging indicators, the data they provide is usually a bit outdated, meaning that traders can not take full advantage of trend reversals, as MACD only confirms this reversal and does not predict it beforehand.
© Copyright 2022, All rights reserved