

Our partner, XM, lets you access a free demo account to apply your knowledge.
No hidden costs, no tricks.

A perfect blend between traditional technical analysis and market psychology, Elliott Wave theory is something every trader should know about. Developed back in the 1930s by Ralph Nelson Elliott, this theory is complex, yet very logical and useful.
The theory is based on the belief that the prices are moving in certain repetitive patterns, rather than having random or chaotic motions. The theory claims that every price movement has two separate segments: impulse waves and corrective waves.
Impulsive waves move in the current direction of the general market trend, while corrective waves move against the current market trend. But, how do you identify these trends, and how can you actually implement them in your trading activities? That is exactly what we are going to discuss in today’s guide to Elliott Wave for beginners.
Ralph Nelson Elliott created the theory in the early 1930s when he was a regular trader. For a long time, Elliott was saying that the price movements in the financial markets were not chaotic, nor random.
“Forces travel in waves, as demonstrated by Galileo, Newton and other scientists.” - Ralph Nelson Elliott
During that time, it was believed that the prices of assets were moving almost randomly. The statements made by Elliott were disregarded for a long time by some traders, but he still came up with a theory that very much changed the way people view price motions.
Elliott noticed that there were some patterns in terms of price movements. Whenever one pattern would end, another would start, and things were going almost like cycles. This phenomenon was heavily researched by Elliott, and he ended up creating the Elliott Wave theory, which is named after him.
This theory claims that price fluctuations are not random whatsoever. In fact, it claims that there are several patterns and waves of changes that can be used by traders to predict possible changes in the near future of the market.
When it comes to understanding Elliott Wave theory for beginners, it is very important to know the differences between the different types of patterns and waves that the theory showcases.
Generally, the theory puts forward two types of waves that can be identified on the trading charts. While it can sometimes be quite tricky to identify them, after some experience it is not a huge issue. So without further ado, let’s discuss the two types of waves according to Elliott Wave theory.
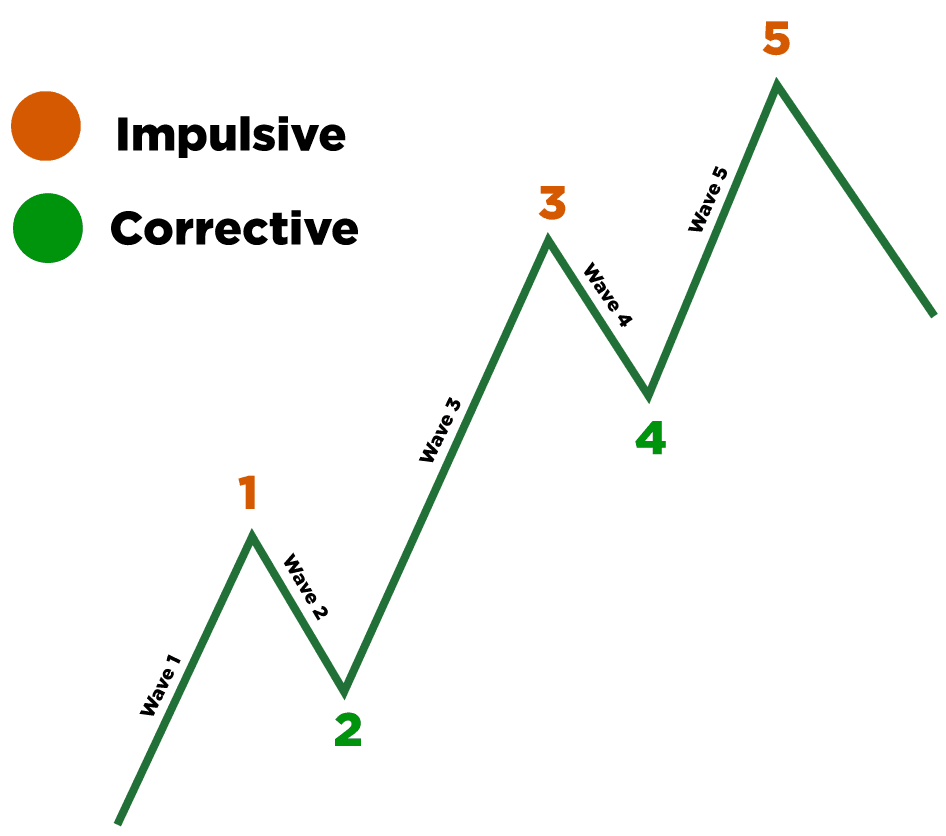
According to the theory, the impulsive wave is a five-wave structure or pattern that can be found on the chart. Elliott found that using numbers and letters was the best option for differentiating between impulsive and corrective waves.
Letters are used for corrective waves, while numbers are used for impulsive waves. The proper labeling for impulsive waves would be 1; 2; 3; 4; 5. But, things are not all that simple and easy. Out of these five numbers, two are actually corrective - 2 and 4. While 1, 3, and 5 are impulsive waves.
When working on identifying impulsive waves, there are some rules that should be kept in mind. First of all, in order for a pattern to be considered an impulsive wave, at least one wave must be extended.
For a wave to be considered extended, it should be longer than 161.8 percent when compared to the second-longest one. In most cases, when you come across really strong impulsive waves, this extension is far beyond the minimum level. Another rule is that the third wave is never the shortest.
The idea of impulsive and corrective waves is the core structure behind Elliott Wave theory, so both of them should be well understood by traders who want to employ this strategy. Following the impulsive 5-wave series, as the theory suggests, traders will start to notice corrections in larger 3-wave structures.
The corrective waves are usually labeled with letters - A, B, and C. The complete Elliott Wave sequence is one that is made up of both, impulsive waves - defined by numbers, and corrective waves - defined by letters.
It is considered a bit tricky to identify corrective waves properly. The reason behind this is that some traders tend to confuse the corrective waves with trend reversals. However, experienced traders should be able to differentiate the two quite easily.
If the corrective wave is followed by a massive fall and a sudden change of trend, it is usually a trend reversal. If the sequence continues to change according to Elliott Wave rules, then you are dealing with corrective waves.
When it comes to identifying Elliott Waves, there are three main rules that traders have to follow. These are:
If the pattern that you have found does not meet these three criteria, it means that you are not dealing with an Elliott Wave setup and you should start looking again. When you are trying to analyze the market using the Elliott Wave theory, there are several aspects that you should keep in mind. For example, a very interesting thing about these waves is that when wave 3 is the longest one, waves 1 and 5 tend to be of the same size.
Understanding these few details about Elliott Waves can help traders better understand how this theory works and find the patterns on the charts in an easier manner.
As we have already mentioned, Elliott Wave theory brings together technical analysis and trader psychology. While working on this theory, Elliott found that the price movements in the market happen in a fractal nature, which helped him define 9 different wave degrees. These wave degrees are as follows:
While these are the degrees that have been listed and described by Elliott, sometimes, they can potentially expand further or become smaller. Understanding these degrees can be quite helpful for traders to know where to start counting waves.
Above, we have discussed impulse and corrective waves, but there can be many others found in the market that can be used by traders for market analyses. The impulse wave, which is made up of three impulses and two corrective waves, can be a sign that the wave is going to move the market, and can be used by traders for their own benefit.
Another type of wave is the Diagonal wave, which consists of 5 sub-waves and is known for moving in the same direction as the trend. This can be understood by traders as a sign that the current trend might continue in the same direction for some time.
Then there is the Zig-Zag wave, which is a corrective wave and is made up of 3 waves that are labeled as A, B, and C. These waves move mostly up or down in a stronger manner. These types of waves can be a sign that the current market trend can change suddenly, and they can be identified in both bullish and bearish markets.
These waves are sometimes shown in combination, which is known as double, or triple zigzag waves. The flat wave is another correction wave and is one of the hardest waves to be identified. This wave can also be a sign of a possible market trend reversal.
A very interesting thing about the Elliott Wave patterns is that they can be interpreted in several different ways. This is why it is very important for traders to use this theory in parallel with other indicators and chose the Elliott Wave software provider carefully. This way, it can become more effective and profitable for traders.
“The forces that cause market trends have their origin in nature and human behavior.” - Ralph Nelson Elliott
Elliott Wave theory is by far one of the most popular theories in the financial markets. As we have mentioned, this theory has forever changed the way people view price movements in the financial markets.
But, it is very hard to make decisions about your positions while depending only on this theory. Traders are encouraged to use the Elliott Wave theory in conjunction with other indicators in the market.
Here are some of the best indicators to use when working with Elliott Wave theory:
All three of these indicators can be very useful for traders who are using the Elliott Wave theory. Let’s discuss how they can be used with the theory below.
The Moving Average Convergence Divergence is among the most popular indicators in the Forex trading market. Many view this indicator as one of the most useful technical analysis tools available in the market.
When utilized with Elliott Wave theory, MACD can provide traders with great trading signals. This is a great indicator to use to further boost your confidence when counting waves. It can be used by traders to better identify trends and waves in the market.
It can be used by traders to make sure that they do not mistake trend moves with corrections that happen in the market. It can also be used to find out more details about the different stages in the Elliott Wave structure.
The Relative Strength Index is another very famous and popular indicator that is commonly used with the Elliott Wave theory.
This indicator is frequently used by traders to find out whether the price of a certain asset is going to keep its current trend, which can come in very handy when employing the Elliott Wave theory.
According to market experts, it is most effective to use RSI during the third wave of the Elliott Wave structure. This can be used to determine whether the market is oversold or overbought, which can be an additional way for you to determine where the trend might be going next.
Traders use Fibonacci retracement along with many other indicators and theories because of how effective it can be. It has a very specific and special role in Elliott Wave theory. It can be used by traders to find support and resistance levels and determine the possible way the Elliott Wave structure might look.
Another very important factor is that all of the waves in the structure relate to the numbers of Fibonacci ratios. This can be further helpful for traders to determine the following wave and make better, and more well-informed decisions.
Our partner, XM, lets you access a free demo account to apply your knowledge.
No hidden costs, no tricks.
It is absolutely worth it to learn Elliott Wave theory. However, a different question is whether it's worth opening the chart and analyzing every single pattern one by one. Rather than doing that, it would be a much better choice to only understand the big wave patterns in the market. This way, the theory becomes less confusing and more beginner-friendly.
The theory has been around for a long time now, and it has proven to be a very successful strategy for a lot of traders. For a long time prior to the Elliott Wave theory, it was largely believed by traders that the price movements in the market happen at random.
However, this theory has forever changed the way people view price movements in the financial markets. This theory can be used by traders to understand how the repeating up-and-down patterns, called waves, work and how they can be used to the traders' advantage.
If you want to count sub-waves of correction, you should start by reading it from the end of the previous motive wave. The Elliott Wave theory says that the motive waves are always followed by corrective waves, while the corrective waves are followed by motive waves. Counting waves can be quite tricky, so ensure that you only focus on larger, more impactful waves to start with.
© Copyright 2022, All rights reserved