

Our partner, XM, lets you access a free demo account to apply your knowledge.
No hidden costs, no tricks.

Are you looking for ways to understand when and why trends are changing in the market? Well, you have come to the right place. In the Forex trading market, there are several things you can do to understand how and when the current market trends might be weakening, or even changing.
Divergence can be a great opportunity to determine how trends might be changing. In the financial markets, divergence can be defined as the process of the asset price moving in the opposite direction of a technical indicator. Divergence can be viewed as a sign that there is a change coming in the market. This might be the trend weakening, or it can be changing altogether.
Divergence in Forex is one of the most common signals used by traders during technical analysis. This can help you predict the possible trend reversals and filter through false signals in the market.
In today’s guide to divergence patterns in Forex, we are going to discuss different types of divergence and how they can influence your trading. So, follow our detailed guide and learn how to understand the future price movements in the market in a precise manner.
- “I believe in analysis and not forecasting.” - Nicolas Darvas
So, let's say that you are trading Forex, and you are using one of the oscillator indicators. You see that the market is having an uptrend, but when you look at the price movements and your indicator, there is a visible difference between their direction. Congratulations! You have found a divergence in the market!
Whenever the price and any of the indicators are moving in the opposite direction, divergence occurs. Although divergence can be a simple signal, there are many traders in the market who are getting confused when trying to understand this concept. However, trading divergence can actually be quite a simple process.
A very common question that beginner traders ask is whether Forex divergence is good or bad. The answer to this question is simple: it is neither good nor bad. It is simply an occurrence that can help traders better understand how the prices are moving in the market.
If you notice that there is a divergence during an uptrend, you can view it as a sign that the trend is getting weaker and there is a possibility for it to change. However, you should keep in mind that divergence does not happen right away. It can be seen in the market for a certain period of time without the trend actually changing.
To ensure you are perceiving divergence in the correct way, it is very important to use different types of technical indicators. It will help you make correct decisions when trading Forex divergence.

Depending on the current market conditions and trends, divergence in Forex can be subdivided into different types. This division usually happens depending on which direction the price is taking. However, divergence can also be differentiated according to how visible it is on the chart, or how long it takes for it to have an effect on the trend.
Below, we will discuss different types of divergences that can occur in the Forex trading market. So, follow our guide to learn more about how divergence can be used for maximum success.
Let's imagine a situation where you are trading the GBP/USD currency pair, and you notice that the indicator you are using (let's say, any of the available oscillators) is moving in a different direction than the price. The divergence would be positive if the price was having a downtrend, and it signaled an increase in the price.
Simply put, this occurs in the market when the asset makes a new low, while the indicator starts climbing.
Sometimes, this is also called bullish divergence. In the Forex trading market, it is viewed as a sign that the market momentum is strengthening, and the price could soon start to move upward and catch up with the information provided by the indicator. The bullish divergence pattern is very commonly followed by a rapid price increase.
This pattern of divergence can be very easily identified in the charts. As already mentioned, divergence can occur between any asset price and any technical indicator.
In the Forex trading market, negative divergence occurs when the underlying security moves to a new high, but the indicator fails to record the high and rather than providing the same signal, forms a new lower high.
When analyzing the technical price movements in the market, it can be seen as a sign that the upside momentum and trend are starting to slow down and can also be a sign of a bearish reversal.
Because it points to a bearish trend reversal, it is also called bearish divergence. This type of divergence occurs in the market somewhat often, depending on the asset you are trading. Just like positive divergence, it can occur between every asset price and any technical indicator.
When this divergence is visible in the market, even though the current trend is bullish, it signals that a change is coming in the near future. This can very likely cause a sudden and rapid decline in price.
In the Forex trading market, extended Forex divergence is very similar to the classic divergences discussed above. However, in this case, the price continues in accordance with the pattern that was forecasted previously before changing its direction. Extended divergence can be both bearish and bullish.
To determine whether you are dealing with extended bearish divergence or not, you should pay a lot of attention to not only the peaks on the chart but the indicator as well. The same goes for extended bullish divergence. The main idea behind this is that the effect of divergence is shown on the prices after some time of its initial occurrence.
If you see that the chart shows an extended bullish divergence, it is time for you to look for a buying opportunity as the prices will soon start to go up. It is very important to check the extended divergence with other indicators as well to confirm your ideas. This way, you will be more confident in making further decisions.
Another type of divergence traders should be aware of is hidden divergence. This type of divergence occurs in the market when your indicator makes a higher high, while the price action is staying the same. In most cases, this can be an indicator that there is still some strength in the current trend and there is a chance for it to continue.
This type of trend is the hardest to recognize in the charts, but it can help traders to decide whether to change their positions or go on with current ones. If you see that there is a hidden bearish divergence on the chart, it means that the price will continue its downward movement.
On the other hand, when a bullish divergence is identified on the chart, it can be seen as an indication that the price increase will continue.
In the Forex trading market, there are many different ways individuals can use divergence for trading. First of all, it can be a leading indicator for Forex traders that happens right before a trend reversal in the market. As we have already defined, this occurs in the Forex trading market when the indicator is not agreeing with the current market price.
This means that a trend reversal is coming, and traders should stay alert. However, it is very important for traders to understand the differences between divergence types as they can have a huge influence on the actual developments that will take place. Also, many traders like to use different types of indicators to double-check divergence.
It is not uncommon in the Forex trading market for one indicator to not agree with the current price, while others do. So, it is always better to be sure of the decisions that you are making during trading.
As long as you are aware of the different types of divergence patterns that you might come across in Forex trading, identifying divergence when trading Forex should not be a big issue.
It is very important, however, to be very precise with your indicators and focus on your charts when trading Forex. This way, you can make sure not to miss out on possible profitable opportunities in the market that could arise thanks to divergence.
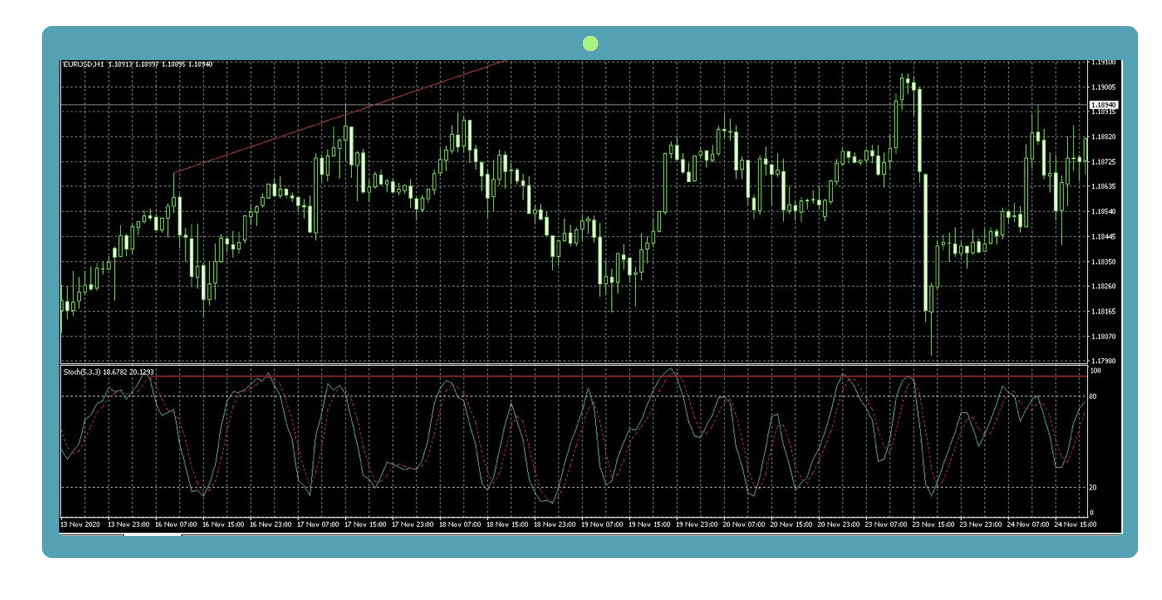
To be able to sot divergence in the charts, the first thing that you will need to do is to see whether the price has already reached a higher high or a lower low. Then, it is important to open your favorite indicators and see the direction that it is showing. Using oscillators is considered a good decision for identifying divergence, as they are open in a separate window below the chart. This way, you can notice if there are any differences between the indicator and the actual price chart.
There are many different indicators Forex traders can use for identifying divergence. As already mentioned, one of the best types of indicators to use is oscillators. A very useful indicator is the Moving Average Convergence/Divergence indicator, or MACD for short. This indicator, even with default settings, can help you to identify the best opportunities to trade.
It is better to use a 1-hour time frame, as it tends to be the most accurate. Another very useful indicator for divergence trading is stochastic. The recommended time frame for this indicator is also 1-hour.
Other indicators can also be used depending on traders’ individual interests and likings.
Our partner, XM, lets you access a free demo account to apply your knowledge.
No hidden costs, no tricks.
Divergence is considered to be accurate. The signals provided by divergence tend to be more accurate in longer time frames. While you might get a few false signals, it is generally viewed as a good strategy to use. If you manage to work on the structure of your trades in the right way, you can actually end up making some good profits thanks to divergence.
In the Forex trading market, divergence occurs when the price is moving in an opposite direction from the indicator. On the other hand, convergence happens when both the price and indicator are moving toward each other. It is considered that divergence is a signal to trade, while on the other hand, the absence of convergence might be a sign that there are some opportunities for arbitrage.
Many indicators can be used for divergence trading FX. Some of these include MACD, Awesome Oscillator, RSI, CCI, stochastic, and many others. In general, any indicator can be used to determine divergence in the market. You can also double-check the information with other indicators.
© Copyright 2022, All rights reserved